Cohorts
This guide covers Kubit's Cohort feature: what cohorts are, how to create them, the five cohort types, compound cohorts, and how to use cohorts across reports.
When to Use Cohorts
Cohorts let you define reusable segments of users (or traces, sessions, spans) based on behavioral or metric conditions. Once saved, a cohort can be applied as a filter or comparison segment across any report type.
Use Case | Example |
|---|---|
Segment analysis | Create a "Power Users" cohort (e.g. users with more than 50 events) and apply it as a filter to any report. |
Behavioral targeting | Define users who triggered a specific error span and track their retention separately. |
Funnel-based segments | Create a cohort of users who dropped off at step 2 of your onboarding funnel. |
A/B comparison | Apply two cohorts side by side in a report to compare metrics between segments. |
Retention-based segments | Segment users who were retained on Day 7 vs. those who churned. |
Complex conditions | Combine multiple cohort conditions with AND/OR logic for precise targeting. |
What is a Cohort?
A cohort is a dynamically evaluated group of subjects that match specific conditions. Cohorts are not static member lists — they recalculate every time they are applied, based on current data and the report's date range.
Cohorts are saved as named entities in the Cohort Dictionary and can be reused across reports without rebuilding conditions each time.
Cohort Types
There are five simple cohort types, each defining membership based on a different data source.
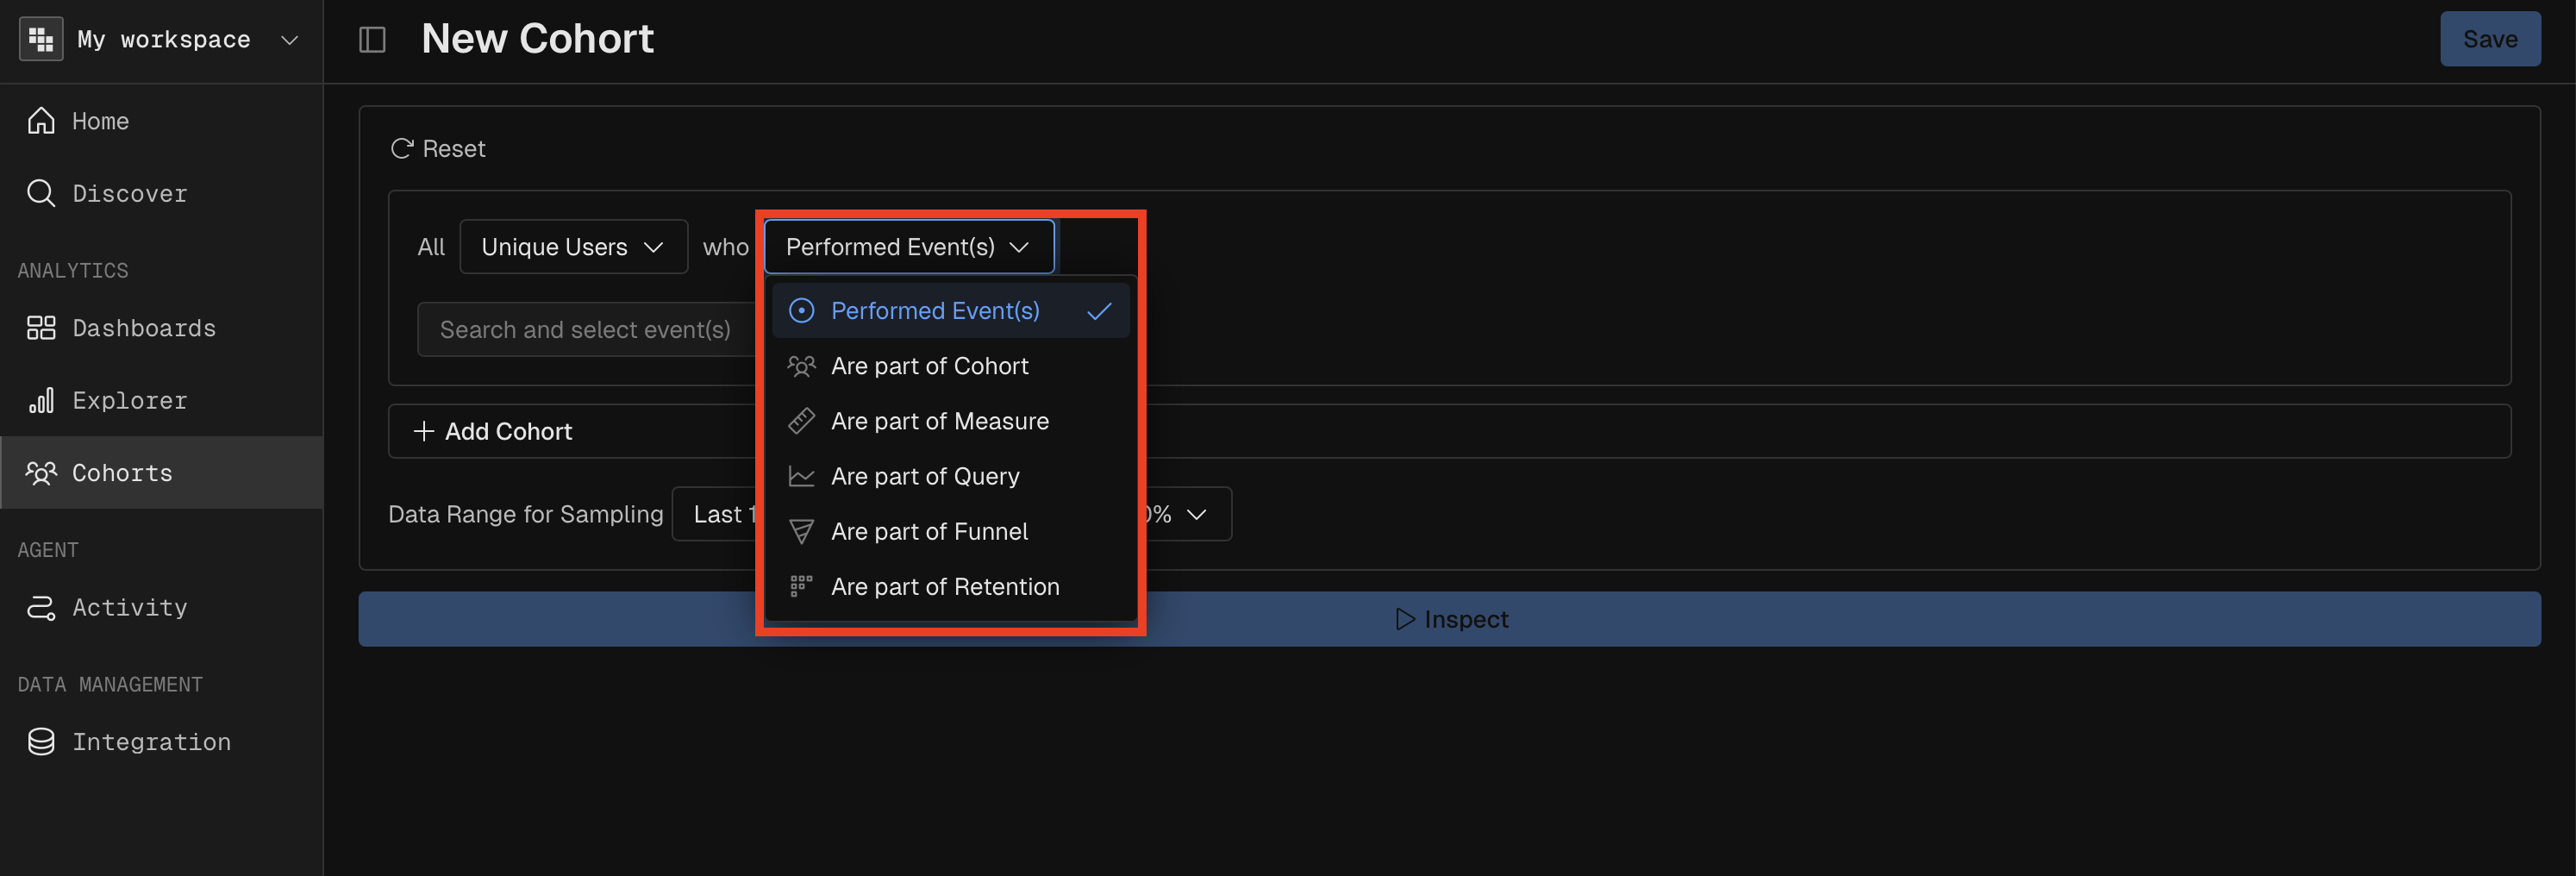
Performed
Segment subjects based on whether (and how many times) they performed specific events.
Setting | Description |
|---|---|
Event conditions | Which events to check for (supports multiple with OR logic) |
Operator | How to evaluate occurrence count |
Operator values | Threshold values |
Operators: is true (performed at all), is false (never performed), equals, not equals, less than, greater than, less or equal, greater or equal, between.
Example: "Users who performed 'tool call' more than 5 times."
Measure
Segment subjects based on whether a measure value meets a condition.
Setting | Description |
|---|---|
Measure | Which measure to evaluate (e.g., Count Distinct spans) |
Operator | Comparison operator |
Operator values | Threshold values |
Percentile filter | Optional — filter by percentile rank instead of absolute value |
Operators: equals, not equals, less than, greater than, less or equal, greater or equal, between.
Example: "Users whose total token count is greater than 10,000."
Expression
Segment subjects based on results from a saved Query report.
Setting | Description |
|---|---|
Analysis | A saved Query report to reference |
Measure | Which measure from that report to evaluate |
Operator | Comparison operator |
Operator values | Threshold values |
Percentile filter | Optional |
Example: "Users whose average latency (from the 'Performance Overview' report) is above the 95th percentile."
Funnel
Segment subjects based on their behavior in a saved Funnel report.
Setting | Description |
|---|---|
Analysis | A saved Funnel report to reference |
Operator | Funnel-specific condition |
Operator values | Which step |
Look-forward window | Days to extend the conversion search window |
Operators: converted on (step N), dropped off before (step N), dropped off since (step N).
Example: "Users who dropped off before step 3 of the checkout funnel."
Retention
Segment subjects based on their behavior in a saved Retention report.
Setting | Description |
|---|---|
Analysis | A saved Retention report to reference |
Operator | Retention-specific condition |
Operator values | Time period values |
Look-forward window | Days to extend the retention search window |
Operators: retained, retained on (period N), retained since (period N), retained between (N and M), not retained, not retained on, not retained since, returned.
Example: "Users who were retained on Day 7 of the onboarding retention report."
Time Windows for Cohorts
Each option will apply additional logic for your Cohort based on when the Subject satisfies the criteria you've selected.
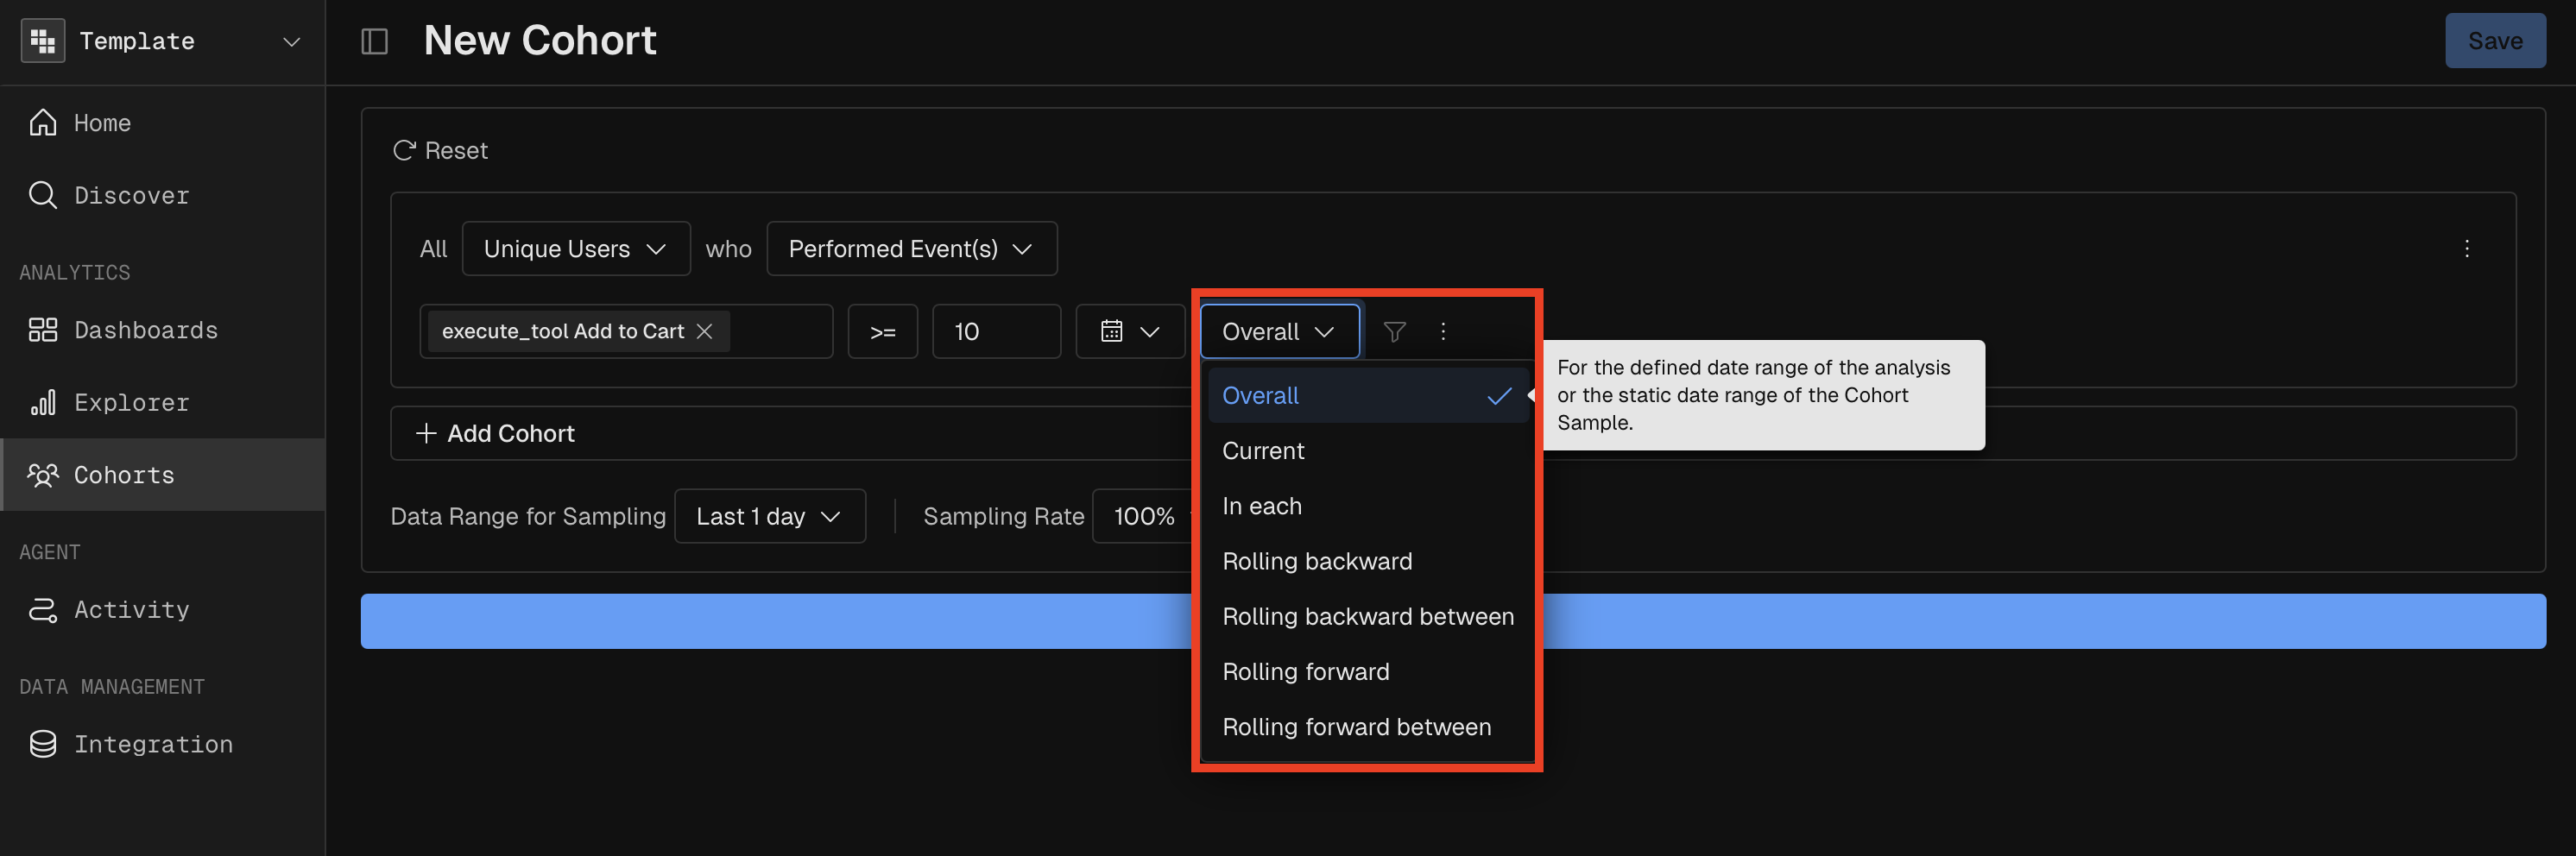
Overall: This option selects all Subjects who met the criteria at least once during the report's entire timeframe or the specified cohort date range.
Current: This option selects all Subjects who met the criteria on the same date as the Report definition event(s). As an example: A Query report measuring Count Events of "Enable Notifications" over the last 7 days with a "Started a Stream" cohort filter set to a "Current" Time Window. This setting ensures the user is only counted if they performed both actions on the same day.
🚧
The Current option does NOT take into account when the subject performed the report definition event(s).
In each: This option selects all Subjects who performed the defined event or measure 'in each' interval of time defined in the report. This option is only available for Performed and Query cohort types. As an example: A Query report measuring Count Events of "Enable Notifications" over the last 7 days with a "Started a Stream" cohort filter set to a "In Each" Time Window.. This will require the user to have performed both Enable Notifications and Start Stream in every individual time bucket (e.g., every day or every week) of the report period.
👍
The In Each option DOES take into account when the subject performed the report definition event(s). Both had to have been performed in each interval of time.
Rolling backward: Subjects are selected as long as they satisfied the Cohort conditions within the X days preceding any given date in your selected range.
As an example:
We want to set a 7-day Rolling Backward window for a "Power User" cohort for a
Single Day: October 15th. To be counted in the cohort, the system looks at the 7-day window immediately preceding it: October 9th - October 15th.
As a result: If the user performed the action on October 10, they are "In" for October 15.
We want to set a 7-day Rolling Backward window for a "Power User" cohort for a
Date Range: October 7th - October 14th. When looking at a period, the 7-day window "slides" for every day in that range. A user is included if they qualify for any of the dates within that span. On October 7: The system looks back to Oct 1, while on October 14: The system looks back to Oct 8.
As a result: The final data point for this weekly period reflects any user who was "active" within their respective 7-day "lookback" window at any point during that week.
Rolling backward between: Subjects are selected as long as they satisfied the Cohort conditions between X and Y days before the report's date range.
As an example:
We want to set a report for January 15th to see how many people used your app. You want to filter this specifically for users who renewed their subscription within the last 7 days, but not today. The cohort criteria in this case will be "Renewed Subscription" with a time window "Rolling Backward Between" 1 and 7 days.
As a result: A user to show up in the report, the system "looks back" at the window between January 8th (7 days ago) and January 14th (1 day ago). If they renewed their subscription during that 7-day window, they are included in the January 15th results.
Rolling forward: Subjects are selected as long as they satisfied the Cohort conditions looking forward X days for any of the dates in the date range.
Rolling forward between: Subjects are selected as long as they satisfied the Cohort conditions between X and Y days after any of the dates in the date range.
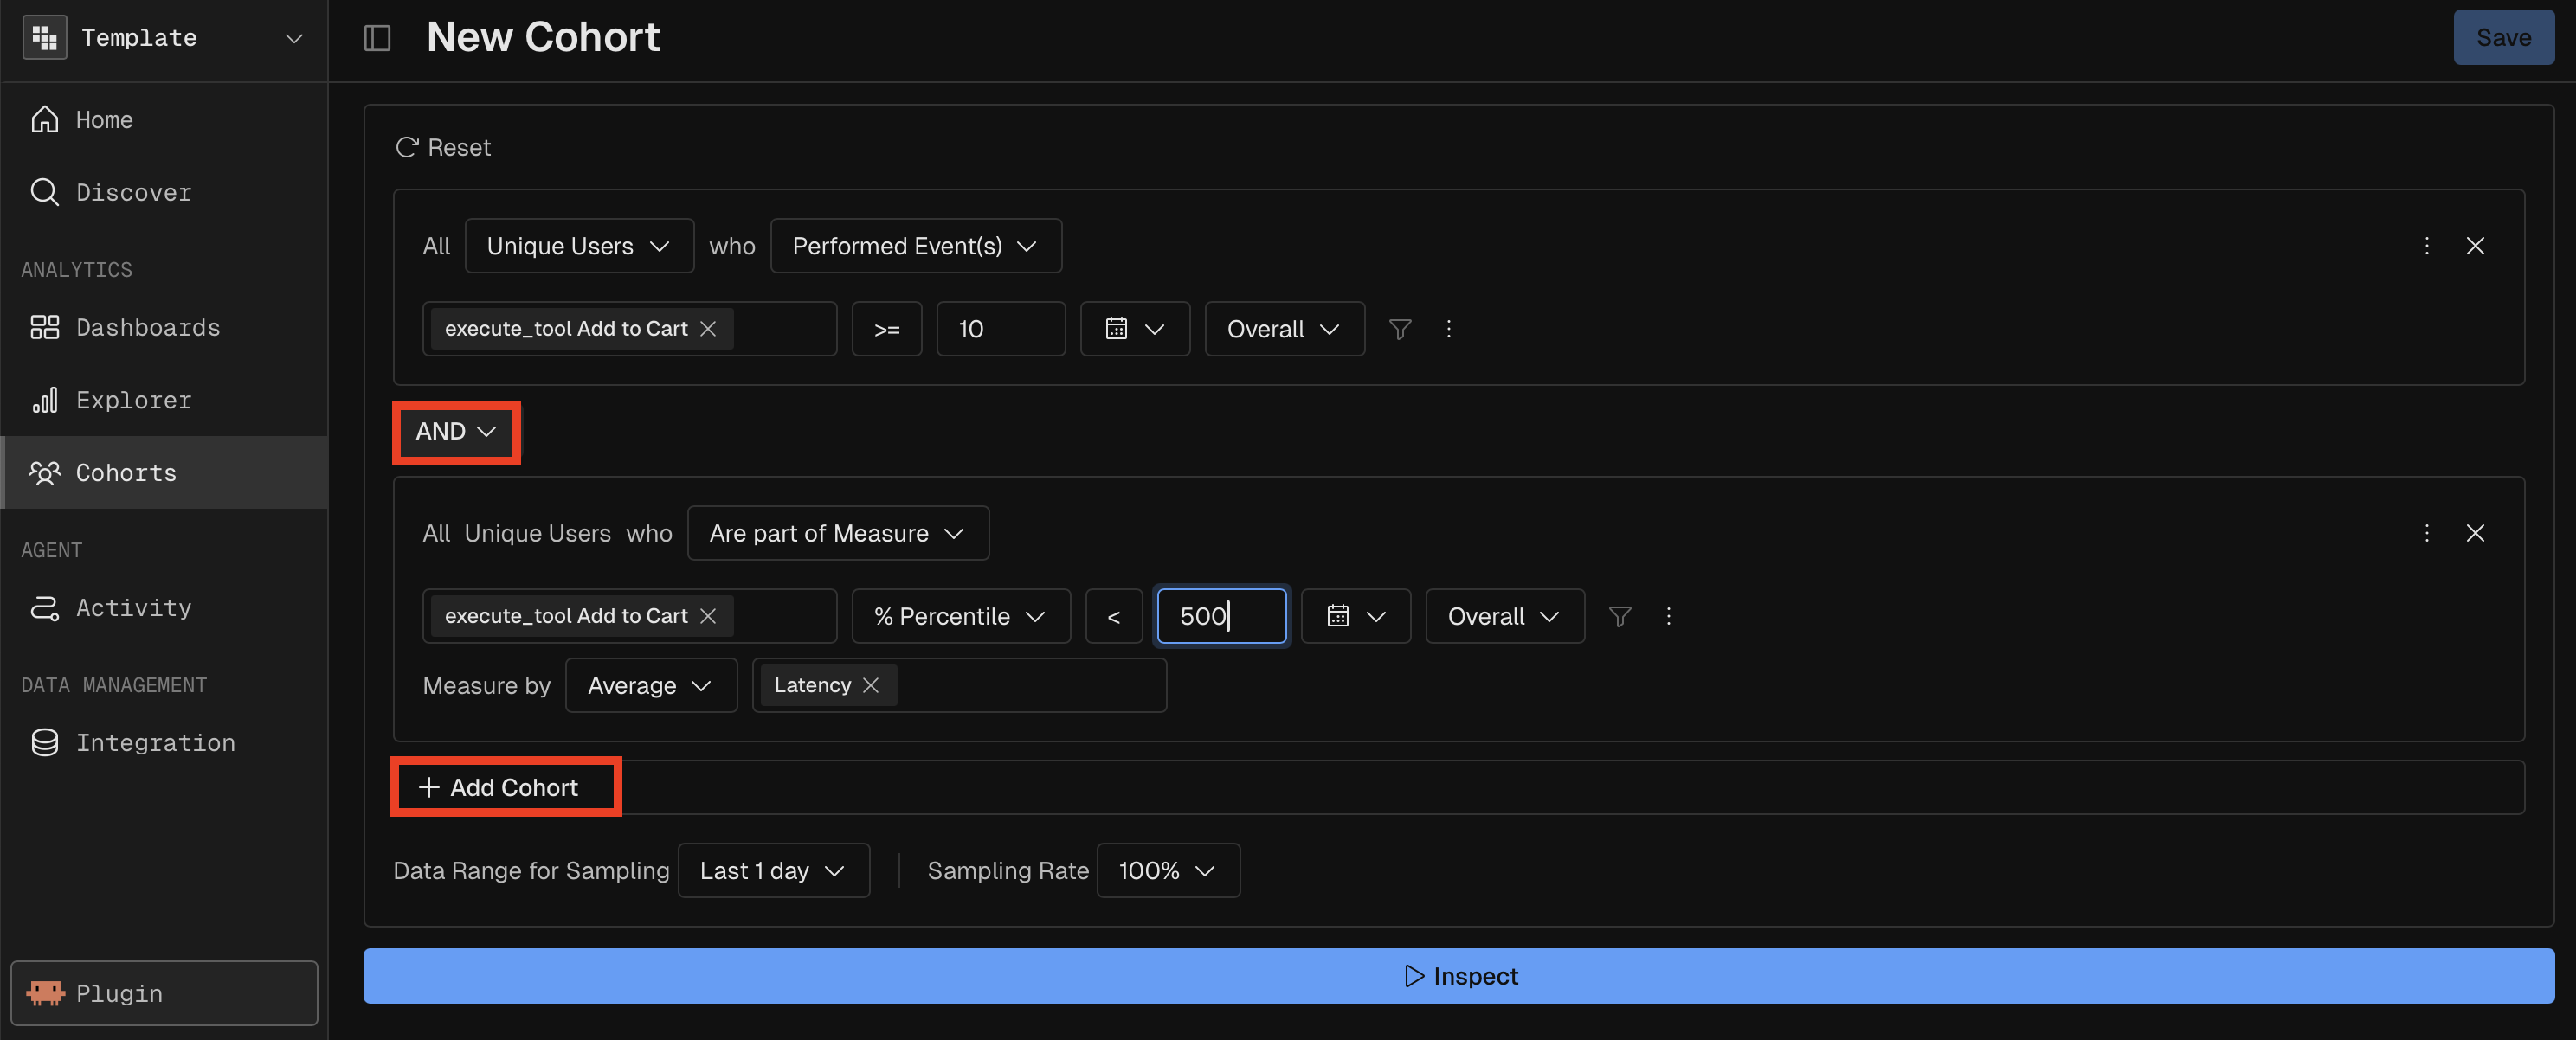
Compound Cohorts
A compound cohort combines multiple simple cohorts using AND/OR logic for more precise targeting.
Constraint | Value |
|---|---|
Max simple cohorts per compound | 3 |
Logic operators | AND, OR |
Example: "Users who performed 'tool call' more than 5 times AND whose average latency is below 500ms" — combines a Performed cohort with a Measure cohort using AND.
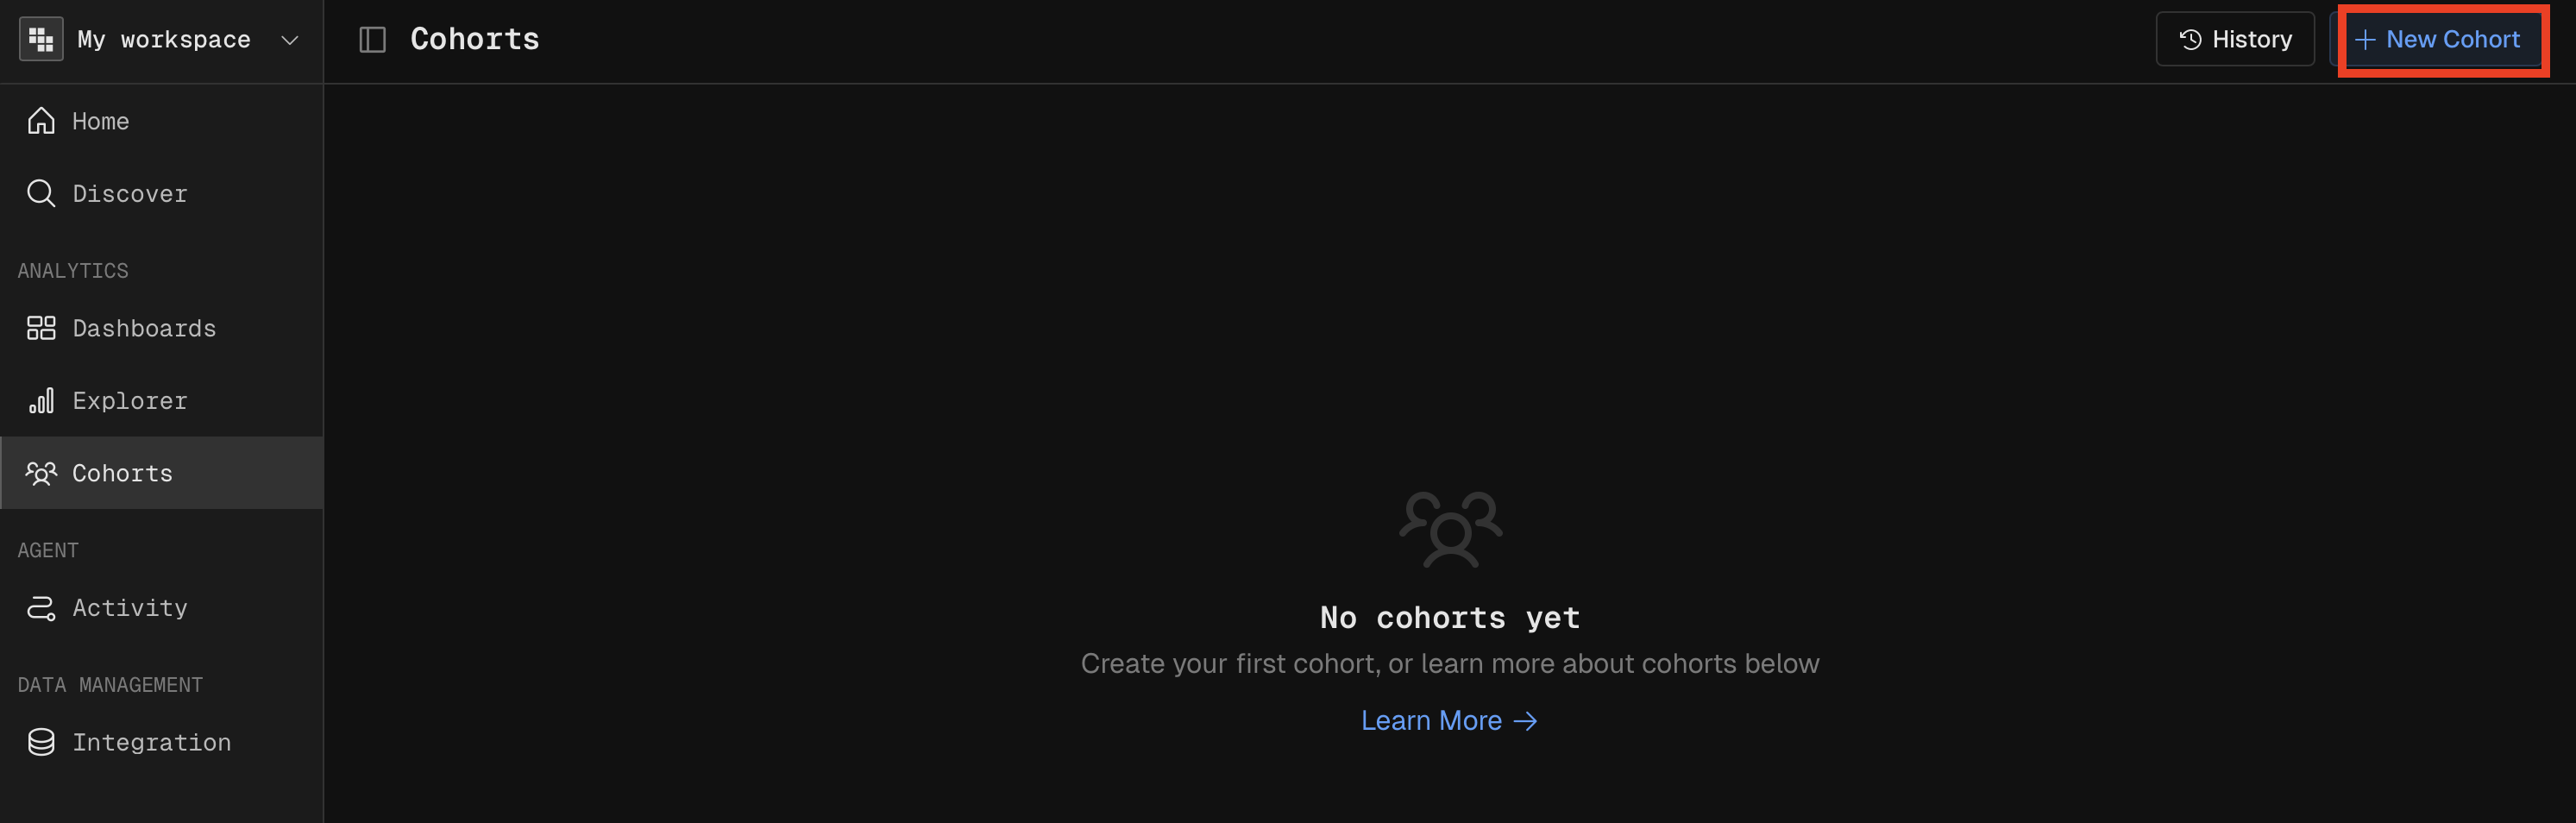
Managing Cohorts
Cohort Dictionary
The Cohort Dictionary (/cohorts) is the central hub for managing saved cohorts.
Feature | Description |
|---|---|
Search | Filter cohorts by name |
Filter | Show "Your Cohorts" or "All Cohorts" |
Sort | Sort by name, creator, or last editor |
Edit | Modify a cohort's name, description, or conditions |
Delete | Remove a cohort (soft delete) |
Categories | Tag cohorts with categories for organization |
Creating a Cohort
Navigate to the Cohort Dictionary and click "New Cohort." Select a cohort type, configure the conditions, preview the results, and save with a name and optional description.
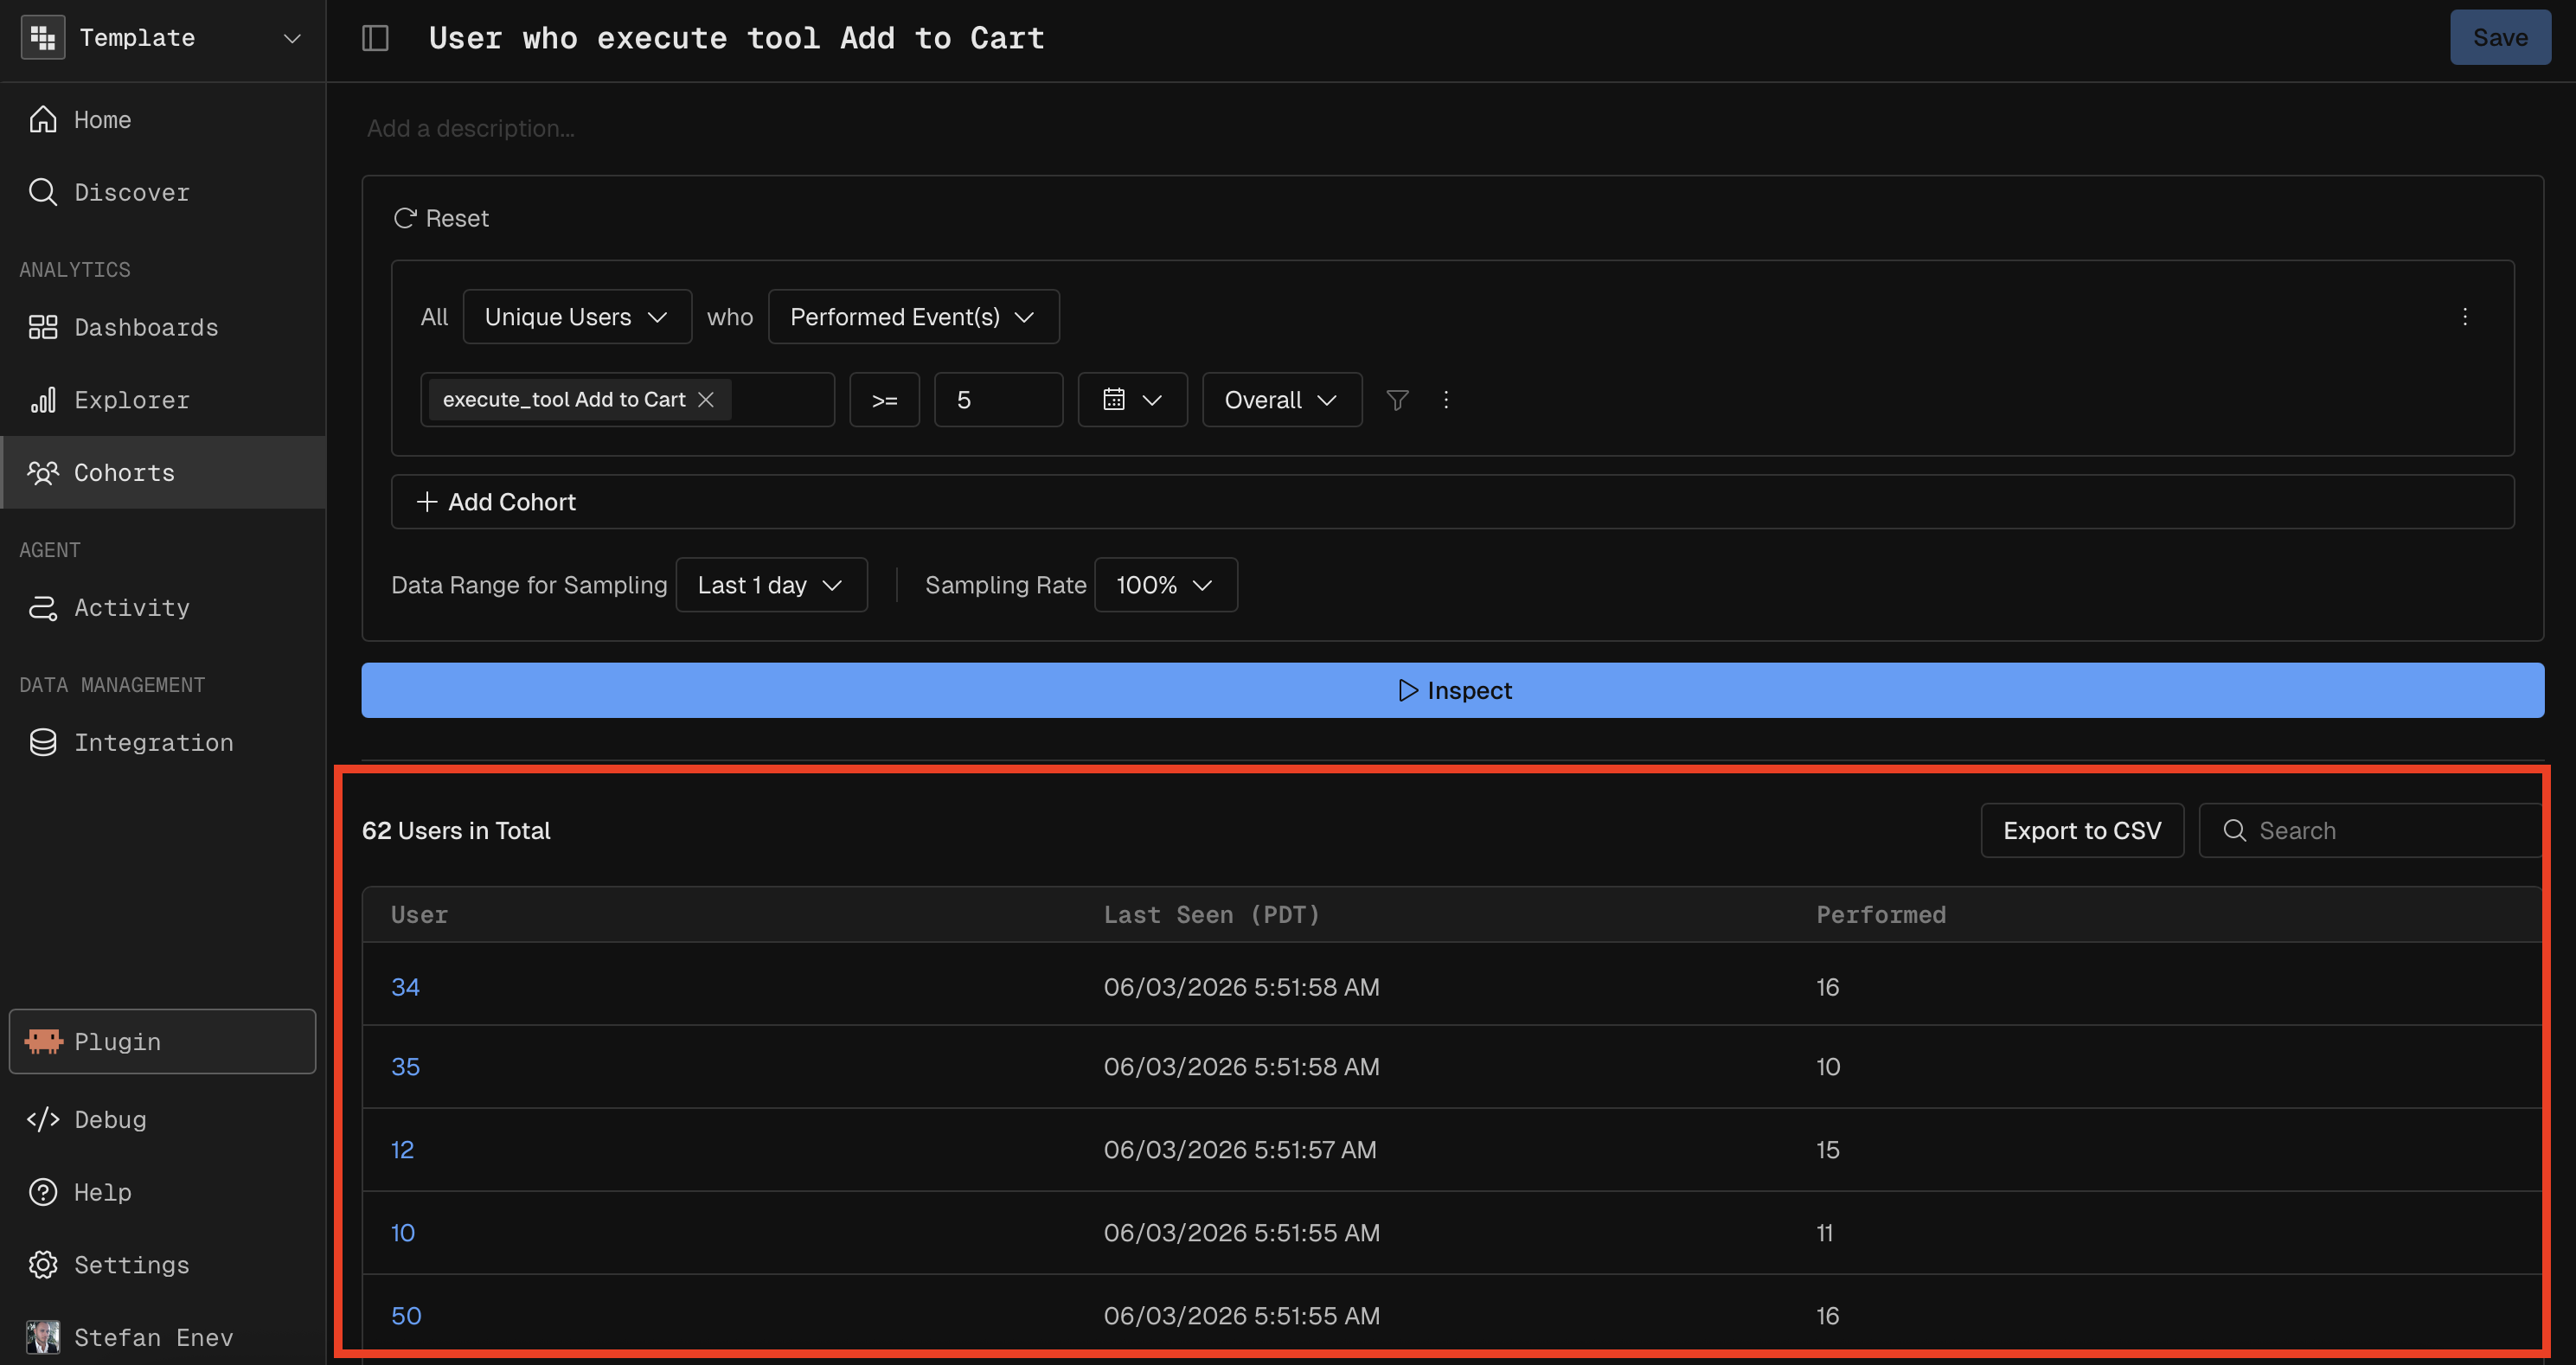
Previewing Results
Before saving, you can execute the cohort by hitting the Inspect button to preview how many subjects match the conditions. This helps validate that the definition captures the intended segment.
Using Cohorts in Reports
Saved cohorts can be applied in two ways across all report types.
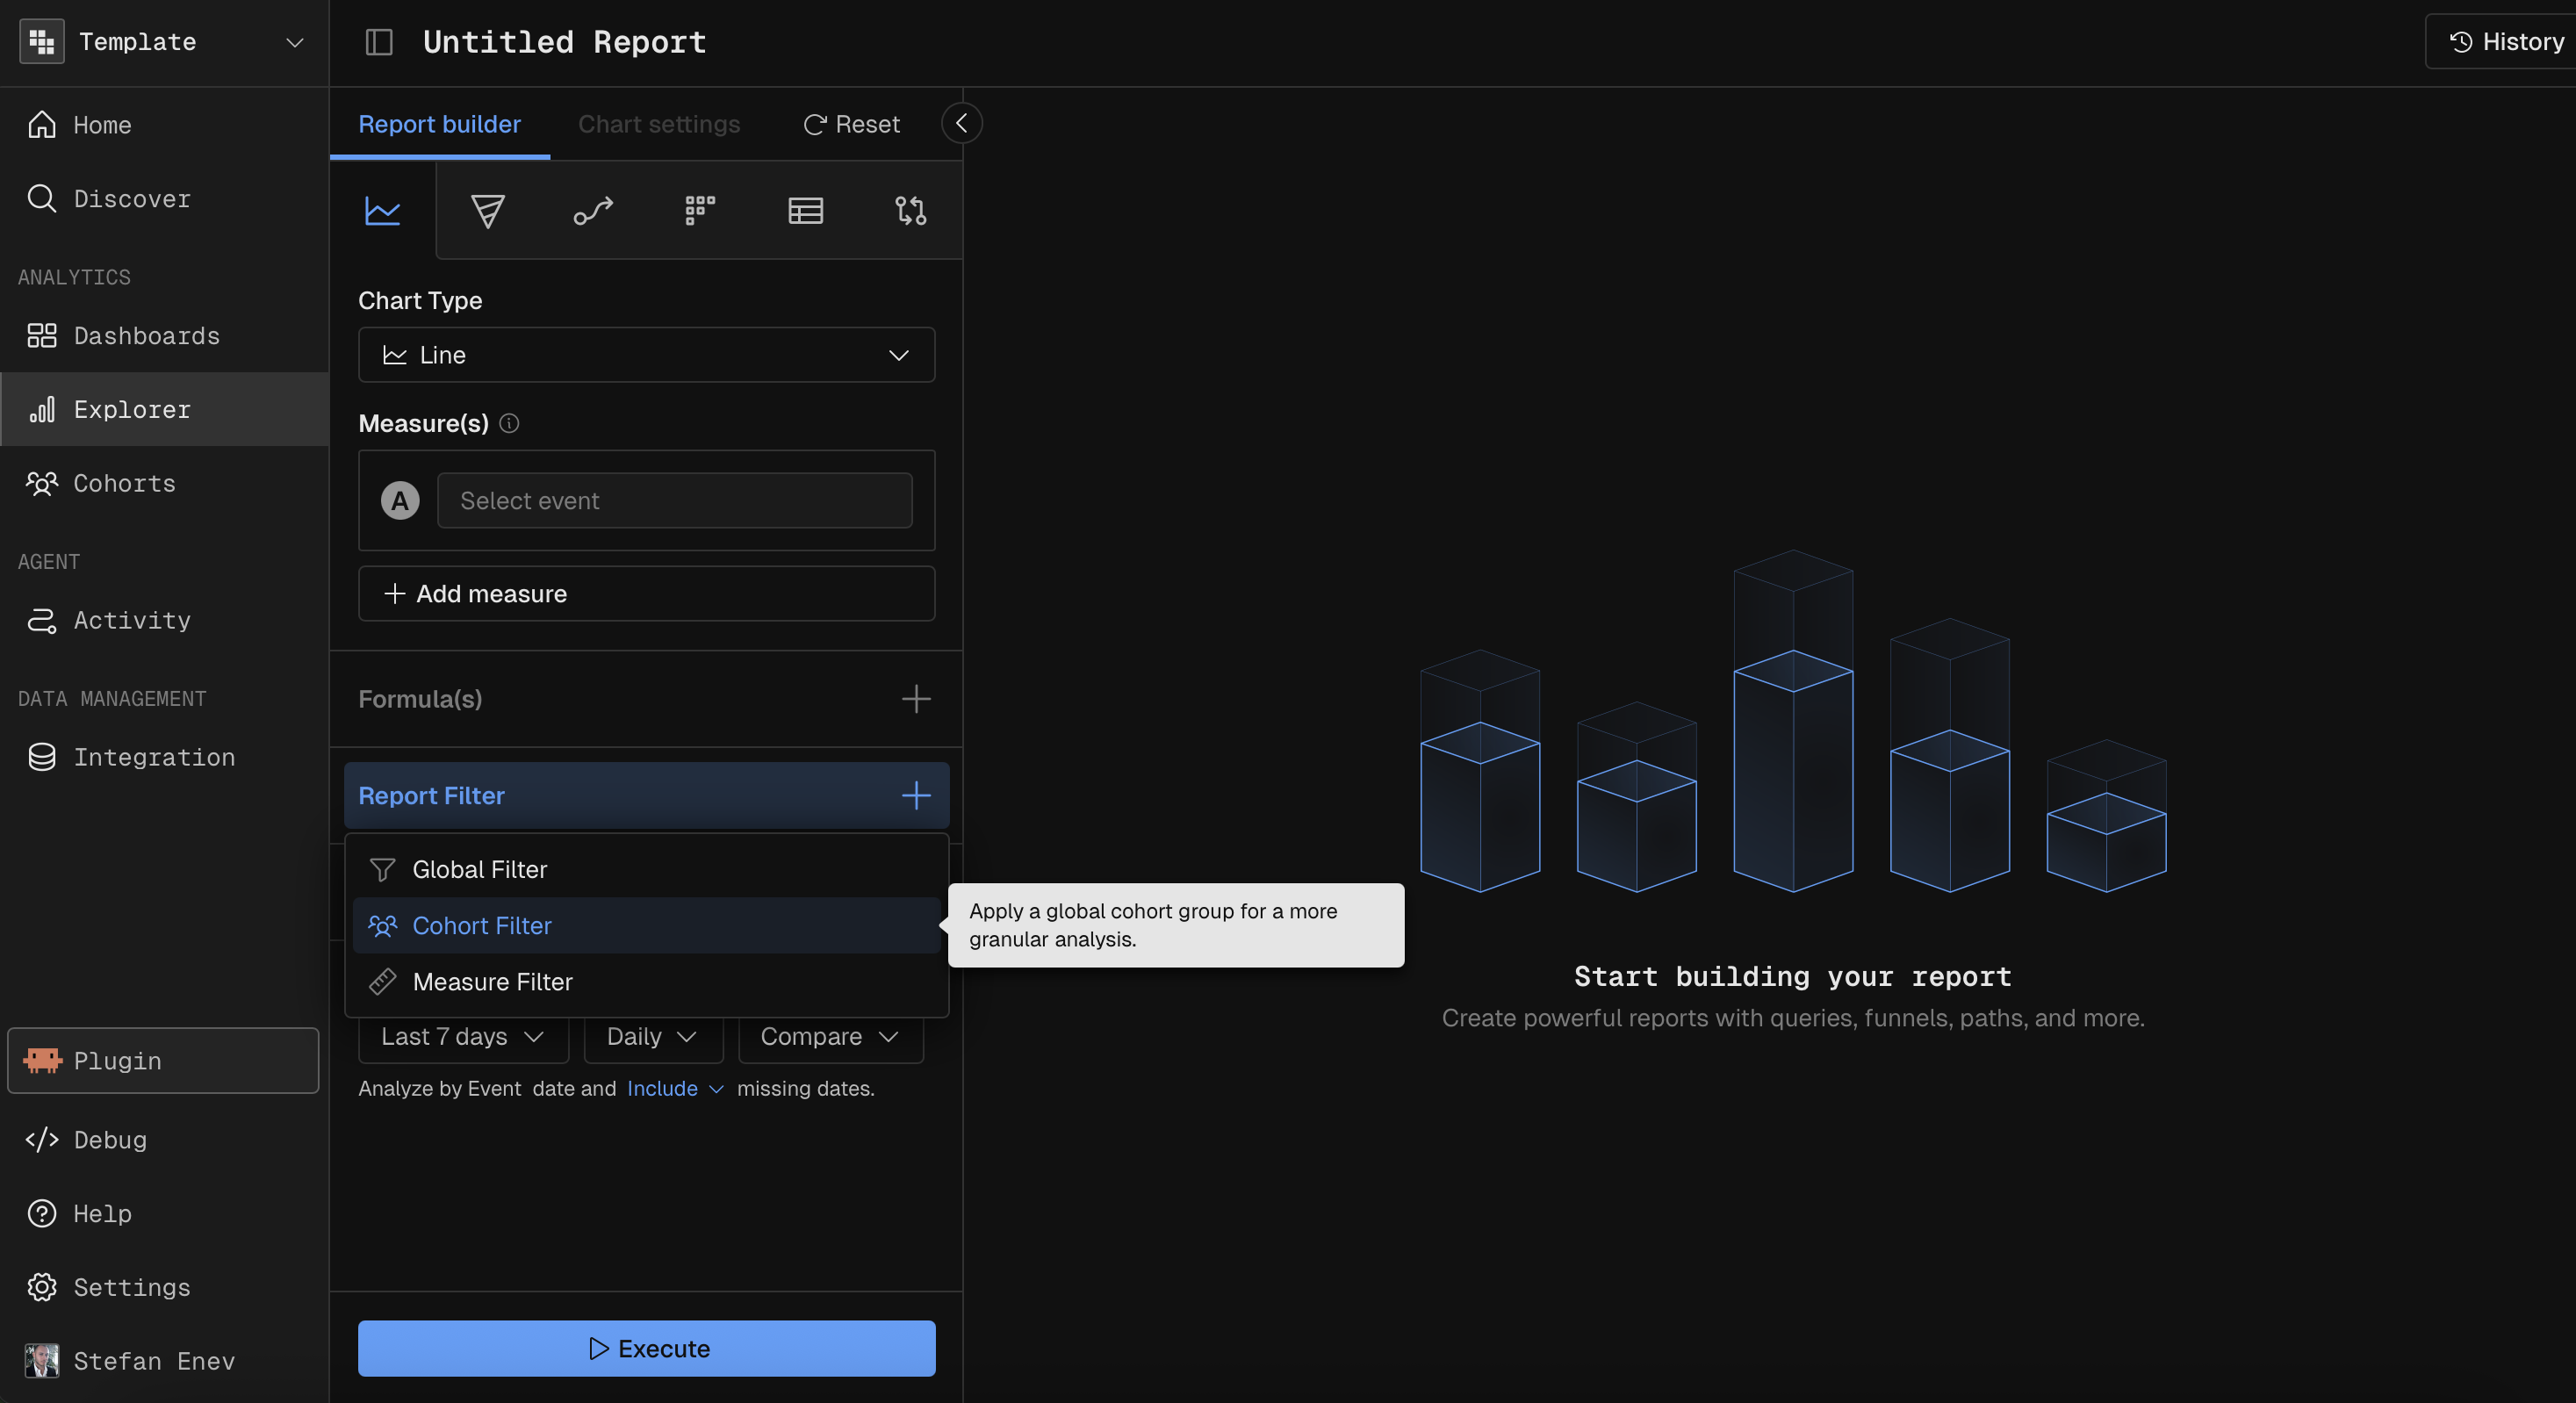
As a Global Filter
Apply a cohort to restrict the report's data to only subjects in that segment. The report runs as if the entire dataset were filtered to cohort members.
Constraint | Value |
|---|---|
Max cohorts as side-by-side filters | 1 |
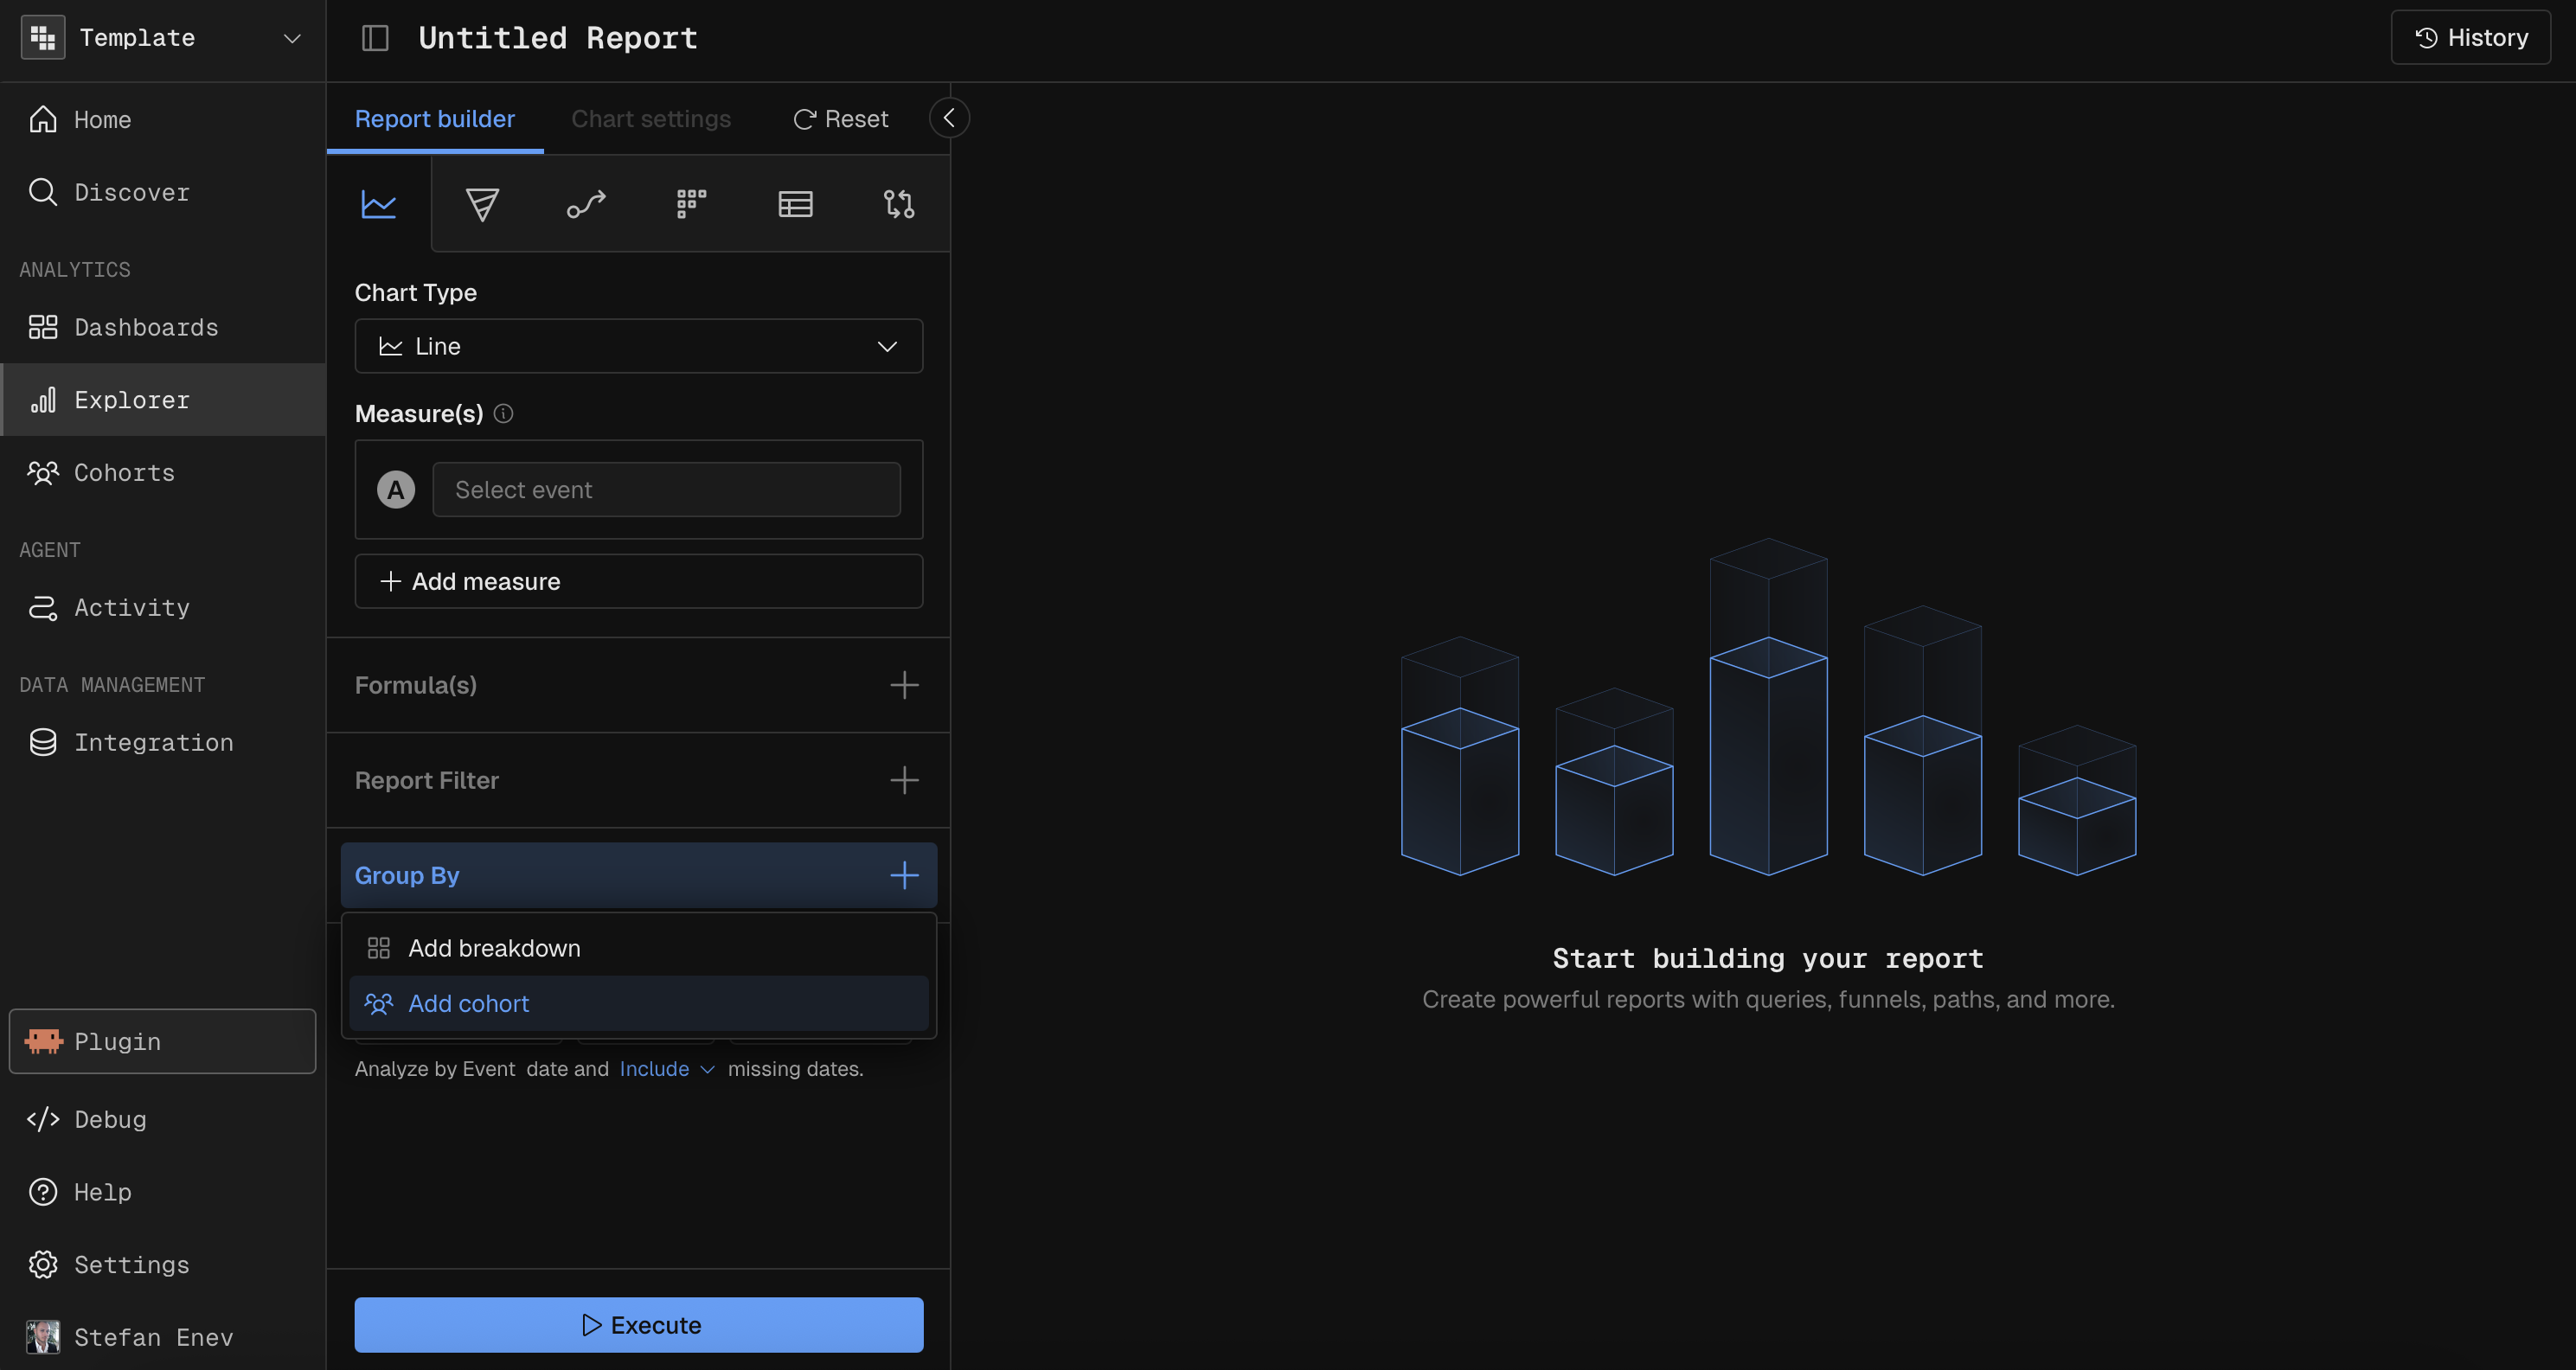
As a Breakdown Segment
Add a cohort as a breakdown segment in the Group By section. The report splits results by cohort membership alongside any other dimension breakdowns.
Constraint | Value |
|---|---|
Max cohort segments in breakdown | 5 |
MCP Prompt Examples
"Create a cohort of users who triggered more than 10 tool calls in the last 30 days"
"Build a cohort of users who dropped off before step 2 of the onboarding funnel"
"Define a compound cohort: users who had more than 5 sessions AND whose average cost is above $1.00"
"Show me daily event count filtered to the 'Power Users' cohort over the last 30 days"
"Compare average latency between the 'Free Tier' and 'Premium' cohorts in a bar chart"
"Create a retention report for the 'New Users' cohort — starting event sign up, returning on any event"