Flow
This guide covers the configuration features of Kubit's Flow report: Subject, Direction, Events, Max Steps, Calculation Method, Display Modes, Flow Adjustments, and Group By.
When to Use a Flow
A Flow report is the right tool whenever you need to visualize how users navigate through your product — what paths they take, where they branch, and where they converge.
Use Case | Example |
|---|---|
Path discovery | See the most common sequences of spans after a user prompt to understand how your AI agent resolves requests. |
Drop-off diagnosis | Trace where users exit a multi-step workflow to find the step that causes the most abandonment. |
Unexpected paths | Discover paths users take that you didn't design for — e.g., users hitting error spans before retrying. |
Backward analysis | Start from a failure event and trace backward to see what led users there. |
Journey comparison | Compare how different user segments navigate the same flow using Group By. |
Choosing the right display:
Use Sankey when you want to see all branching paths in a visual diagram.
Use Top Paths when you want a ranked list of the most common end-to-end journeys.
Subject
The Subject defines the entity whose journey is being traced — whether you're following users, traces, sessions, or spans through the flow.
Subject | Description |
|---|---|
User | Tracks unique users across events |
Trace | Tracks unique traces (end-to-end requests) |
Session | Tracks unique sessions (groups of related traces) |
Span | Tracks unique spans (individual operations) |
Direction
Direction controls whether the flow follows events forward or backward in time.
Direction | Description |
|---|---|
Forward | Start from the starting event and follow what happens next. The default. |
Backward | Start from the ending event and trace back to see what preceded it. |
Constraint: When using Top Paths mode, direction is locked to Forward.
Backward flows are useful for root-cause analysis — start from an error or drop-off event and see the paths that led there.
Events
Every flow requires a starting event and an ending event. These define the entry and exit points of the journey you want to analyze.
Starting Event — the event(s) that begin the flow. Multiple events can be specified (OR logic).
Ending Event — the event(s) that complete the flow. Multiple events can be specified (OR logic).
Each event can include optional property filters to narrow which occurrences qualify.
Constraints
Constraint | Details |
|---|---|
Starting event | Required. Cannot be "Any" when direction is Forward. |
Ending event | Required. Cannot be "Any" when direction is Backward. |
Max event conditions | 5 per event |
Max Steps
Max Steps controls how many intermediate steps the flow displays between the starting and ending events. More steps reveal more granular paths; fewer steps give a higher-level overview.
Setting | Value |
|---|---|
Minimum | 2 |
Maximum | 15 |
Default | 5 |
Suggested presets | 3, 5, 7, 10 |
Calculation Method
The calculation method determines how subjects are counted at each step in the flow.
Method | Description |
|---|---|
Uniques | Count each subject once, even if they passed through the same step multiple times. The default. |
Totals | Count every occurrence, including repeat passes by the same subject. |
Use Uniques when you care about how many distinct users took a path. Use Totals when you care about overall traffic volume through each path.
Display Modes
Flow reports support two visualization modes.
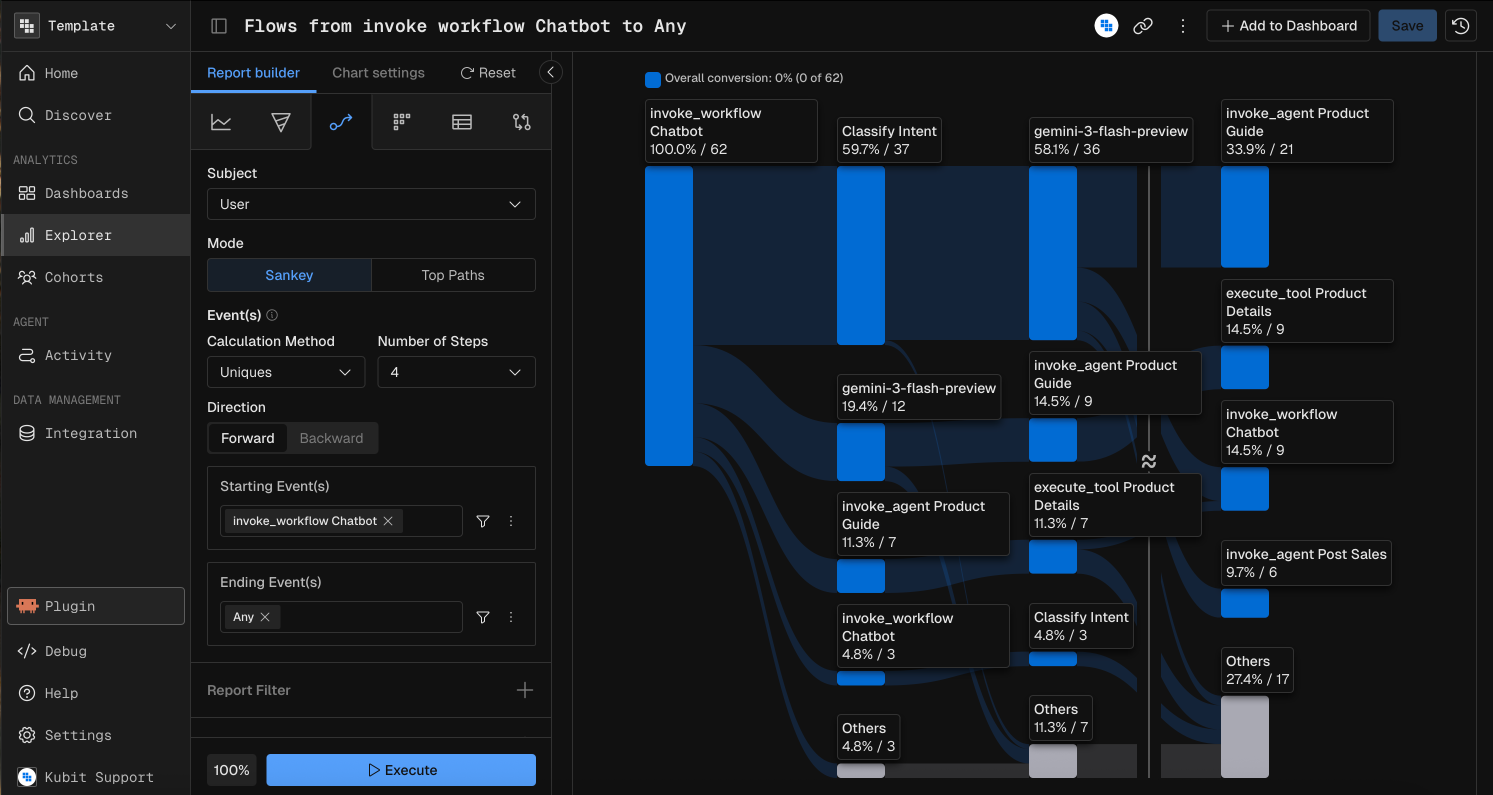
Sankey
A Sankey diagram showing all branching and converging paths as connected nodes and links. Each node is an event, and each link's width represents the volume of subjects transitioning between events.
The Sankey view supports interactive adjustments — merge, expand, and fold operations (see Flow Adjustments below).
Statistics displayed:
Start subjects (how many entered the flow)
End subjects (how many reached the ending event)
Top Paths
A ranked list of the most common end-to-end paths through the flow. Each path is displayed as a mini funnel showing the exact sequence of events and the subject count at each step.
Constraint | Details |
|---|---|
Direction | Forward only — Top Paths does not support backward analysis. |
Filters in Flow
Applying filters in a Flow report can happen in several different places. Each place will change the impact of the Filter so review the options to best suit your needs.
Filter on the Starting / Ending Events
If you're only concerned with users viewing a specific Page then clicking a specific button you can apply filters to the Starting and/or Ending events to restrict your Flow.
This filter will only impact the users included in the Starting or Ending step.
Filter Entire Flow Report
If you want to exclude data from the entire Flow report you can apply a Report Filter. This will limit all data returned. It's a great option if you only want to view a Flow for a specific App Version, Platform, or Feature.
👍
Pro Tip
If you have noisy events that you don't want to appear on your Flow you can Filter by Event Name as well. Adding a filter like
Event Name != "noisy event"will eliminate it from your Flow.
Flow Adjustments
After running a flow, you can refine the Sankey visualization with these optional adjustments:
Adjustment | Description | Max |
|---|---|---|
Merge Events | Combine multiple events into a single node (e.g., merge similar tool call variants vertically on the chart). | 3 |
Expand Events | Split one event into multiple nodes by a field value (e.g., expand "generation" by model name). | 10 |
Fold Events | Collapse consecutive repeated steps into one (e.g., fold repeated retry loops horizontally on the chart). | 5 |
These adjustments appear in a "Flow Adjustment(s)" section when added and only apply to the Sankey visualization.
Additional Settings
Group by
This is only applicable when there is a Breakdown in your Flow report.
Starting: breakdown applied over the Starting Event(s), subsequent steps do not have to fall within the same breakdown group.
Global: Starting, Ending Event(s) and all events in between have to happen within the same breakdown group.
Partition
Day: by default Partition the events by Day (all events have to happen within the same calendar day).
Session (OPTIONAL): for customers interested in Session analysis we can supply an additional option to tell Flow that all events have to happen within the same session.None: this is useful when analyzing longer-term customer behavioral patterns. For example, any Subscription business would be interested in conversions from Trial to Subscription to Renewal and try to understand what makes users subscribe and then stay.
Conversion Window: all the steps in the Flow have to happen within the same time period defined by the Conversion Window. Supported time units are Seconds/Minutes/Hours/Days/Weeks/Months/Years. Conversion Window can be used in combination with partitions Day or None so make sure not to use it with Partition: Day whenever the time unit is set tDays or longer.
Create a Funnel from Flow
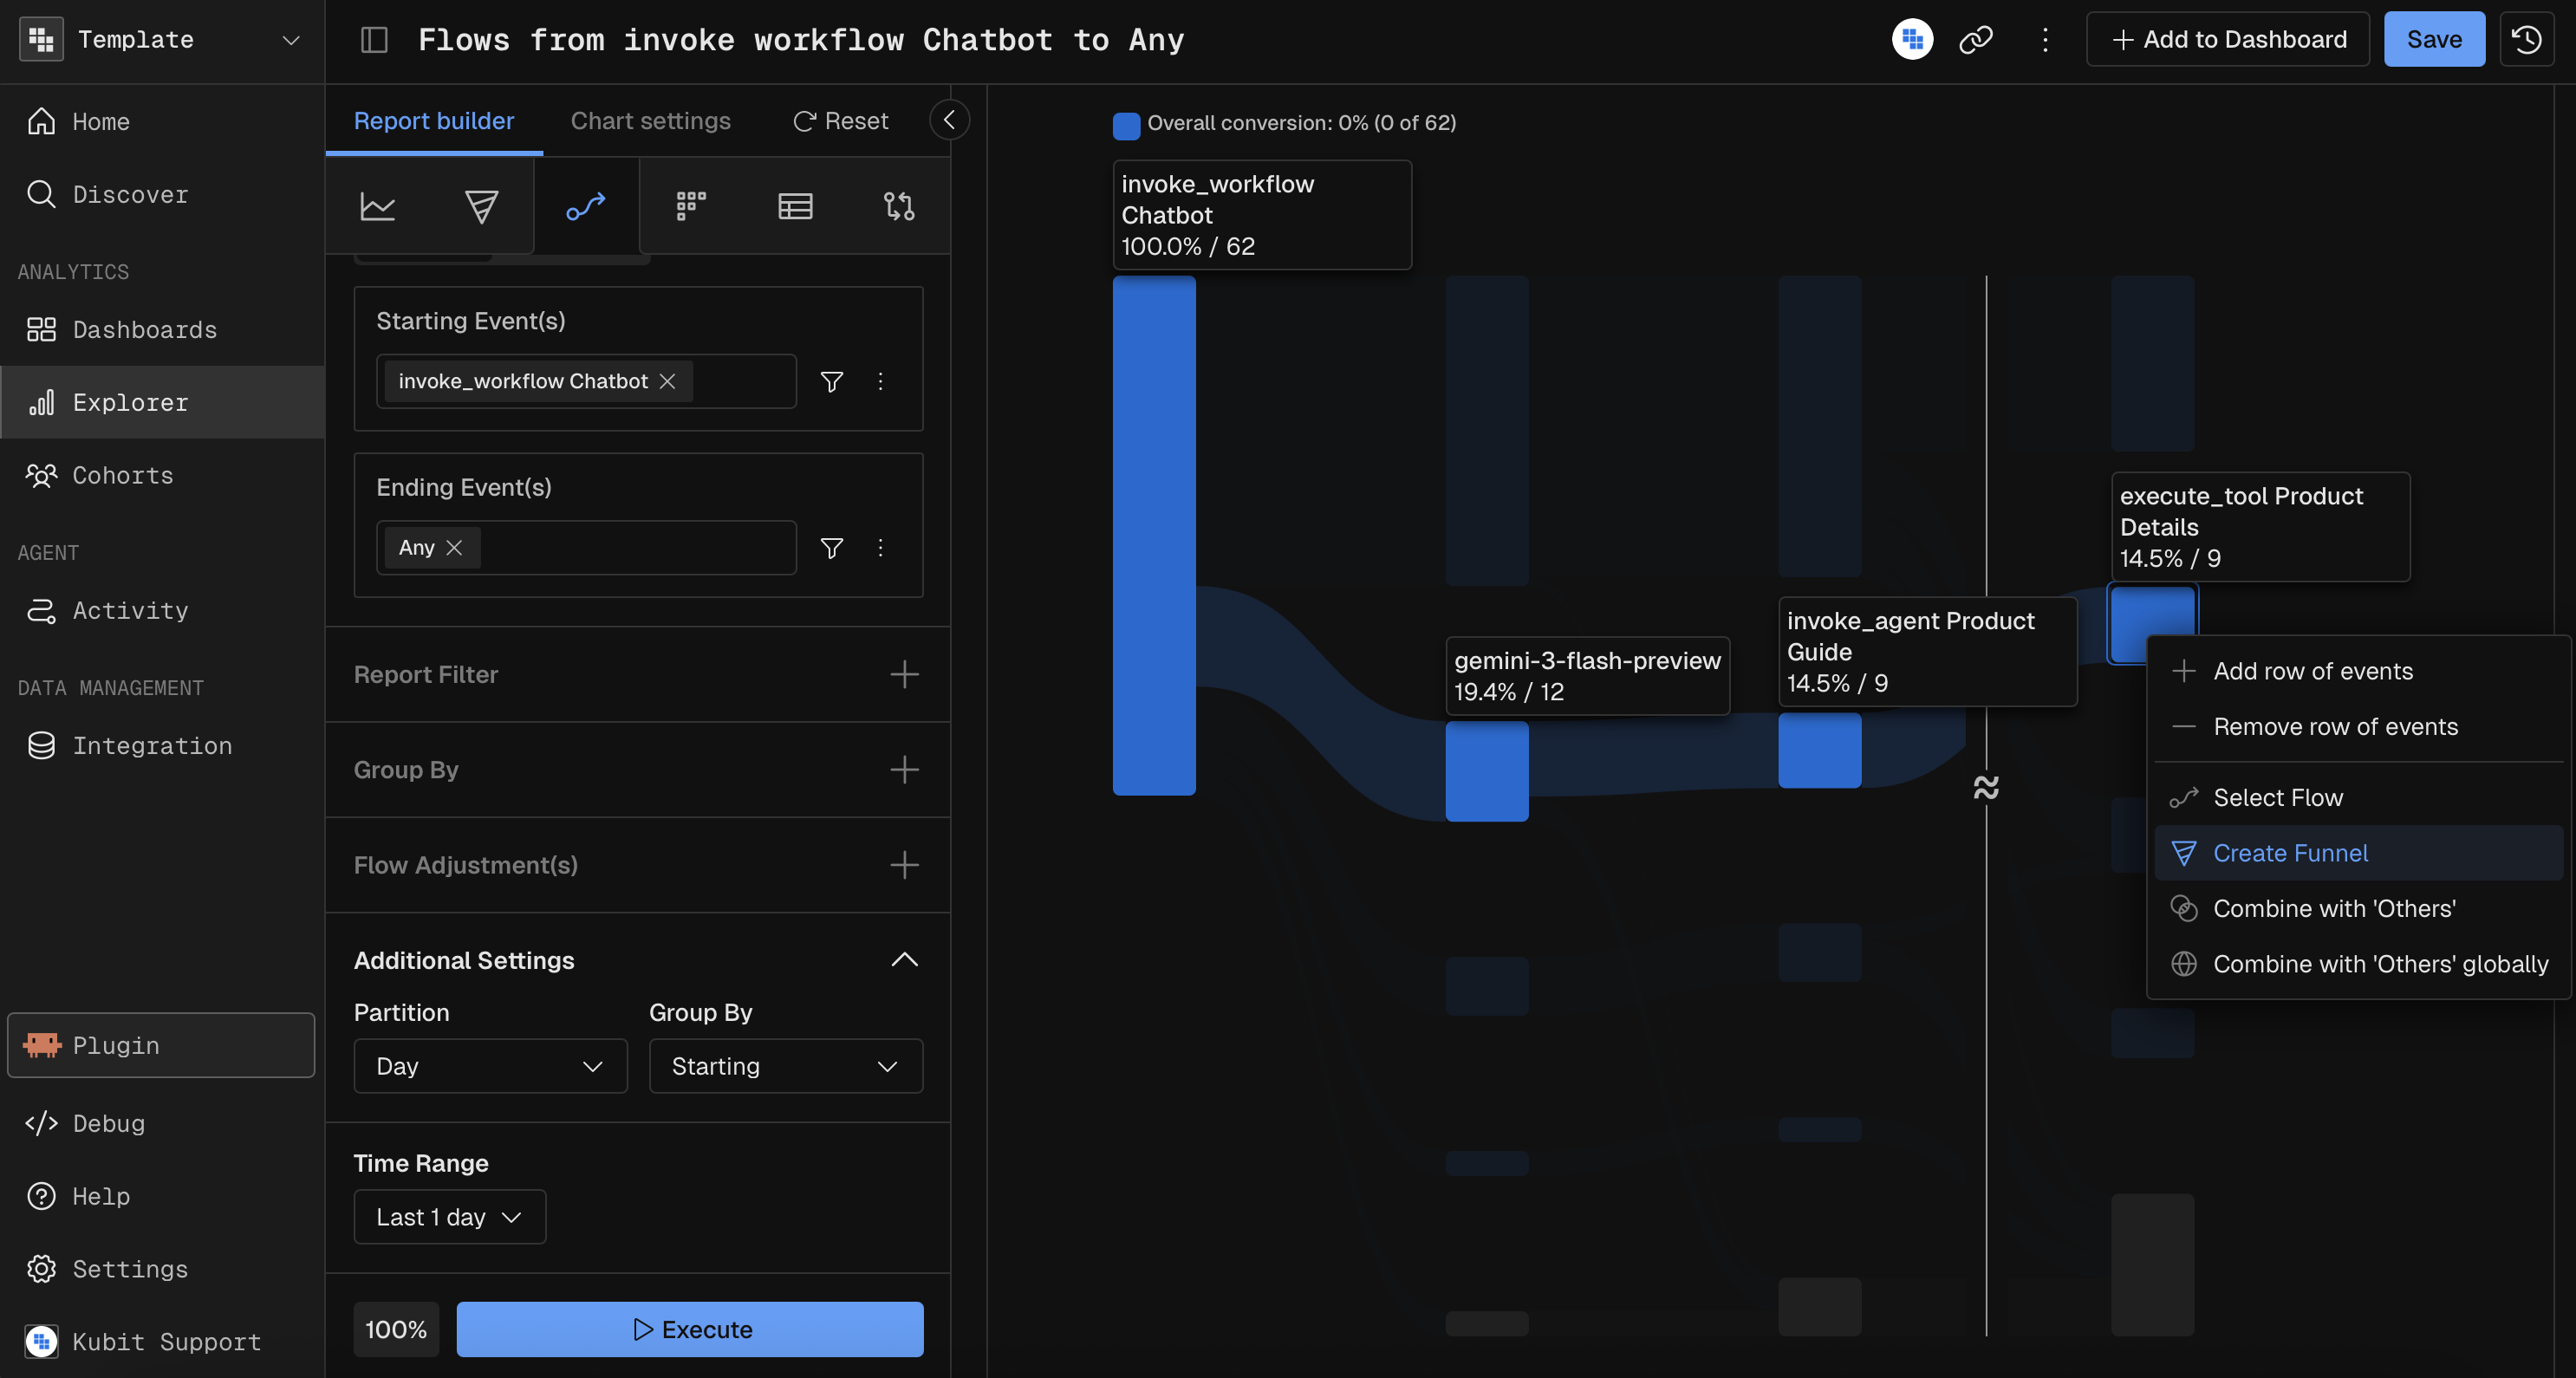
When exploring user journeys in Flow, you might find a particular journey that stands out. To enhance this journey, you can monitor conversion rates over time by creating a Funnel. This can be done quickly with just a few clicks:
Click on the step of the Flow where you want your Funnel to end.
Click on
Create Funnel.
The new Funnel will automatically use the Partition, Subject, Time Unit, Date Range, and Breakdown from the Flow. The Order is set to Exact by default, reflecting what you see on the Flow, but you can adjust it as needed.
Key Features
Partition and Subject: The Funnel inherits these settings from the Flow, ensuring consistency in analysis.
Time Unit and Date Range: These are also carried over, allowing you to track changes over the same period.
Breakdown: Maintain the same segmentation for detailed insights.
Limitations
Can't have
Otheras ending step (won't seeCreate Funneloption when you click on top ofOthers)If the Flow is using Expand/Merge/Fold events the
Create Funneloption will be disabled on click (greyed out)The Funnel is always created from the beginning of the Flow. Only the end is defined by the user.
You can only create Funnels when the Flow
Directionis set toForward. When set toBackwardtheCreate Funneloption will be disabled on right-click (greyed out).
Interpreting Flow Results
There are several data points when your Flow report is rendered. We show you to the Top 25 occurrences which captures the large majority of paths that users take. This means if a user doesn't perform one of the Top 25 occurrence steps they will not be visible or counted in the results.
Main Node Numbers
The primary nodes are the deep blue boxes at each step of a Flow. We will display the % of users who performed that event as their Nth step in the flow. We will also display the absolute value of the selected Calculation Method (Uniques or Totals).
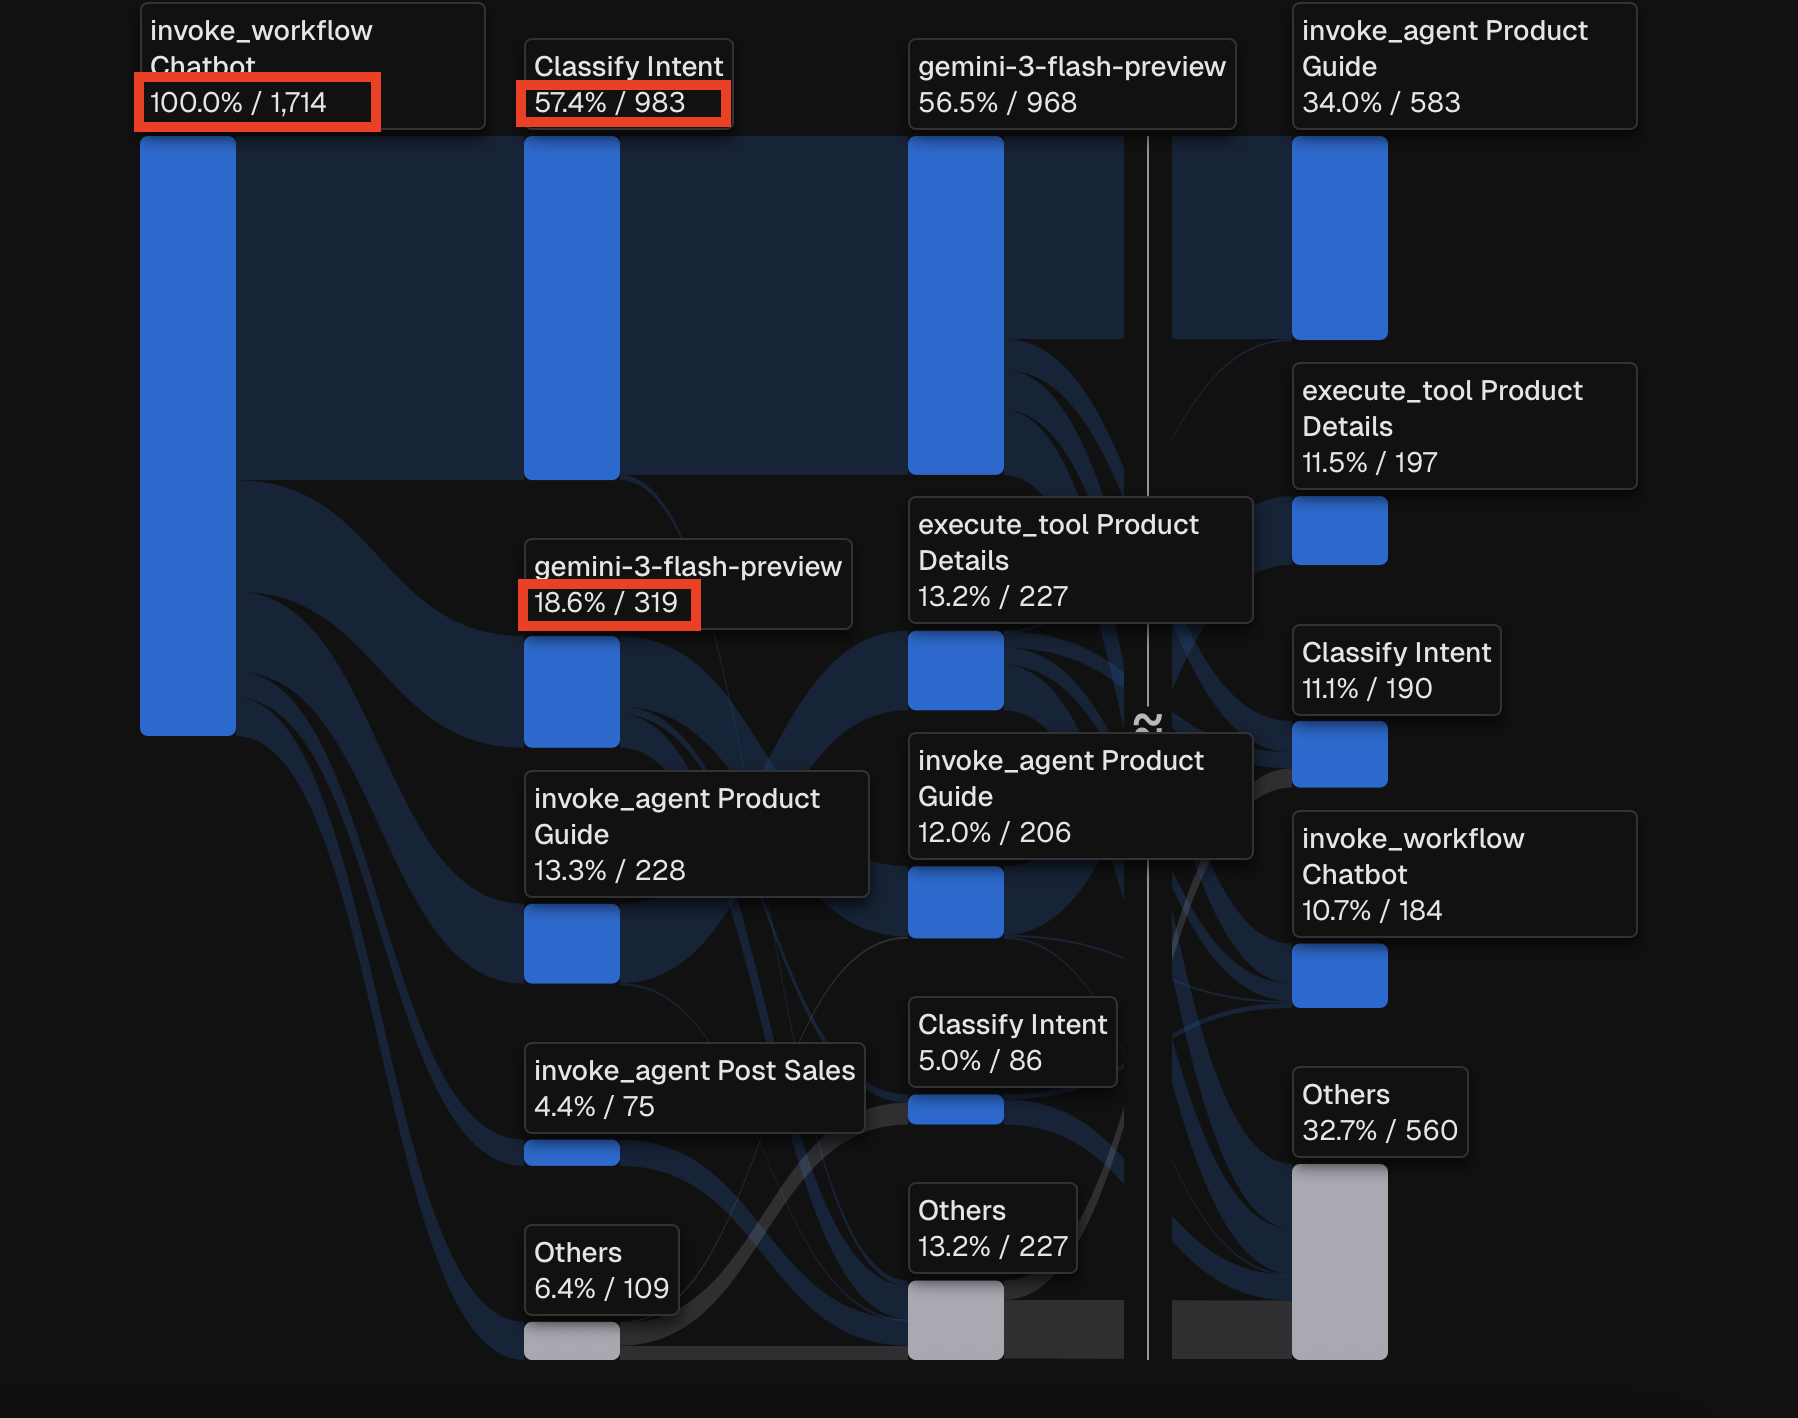
Example: 57.4% of users went from invoke_workflow Chatbot to Classify Intent as their 2nd step. This equates to 983 unique users.
Example: 18.6% of users go from invoke_workflow Chatbot to gemini-3-flash-preview as their 2nd step. This equates to 319 unique users.
Vertically on every step the percentages will add up to about 100% (depending on rounding errors).
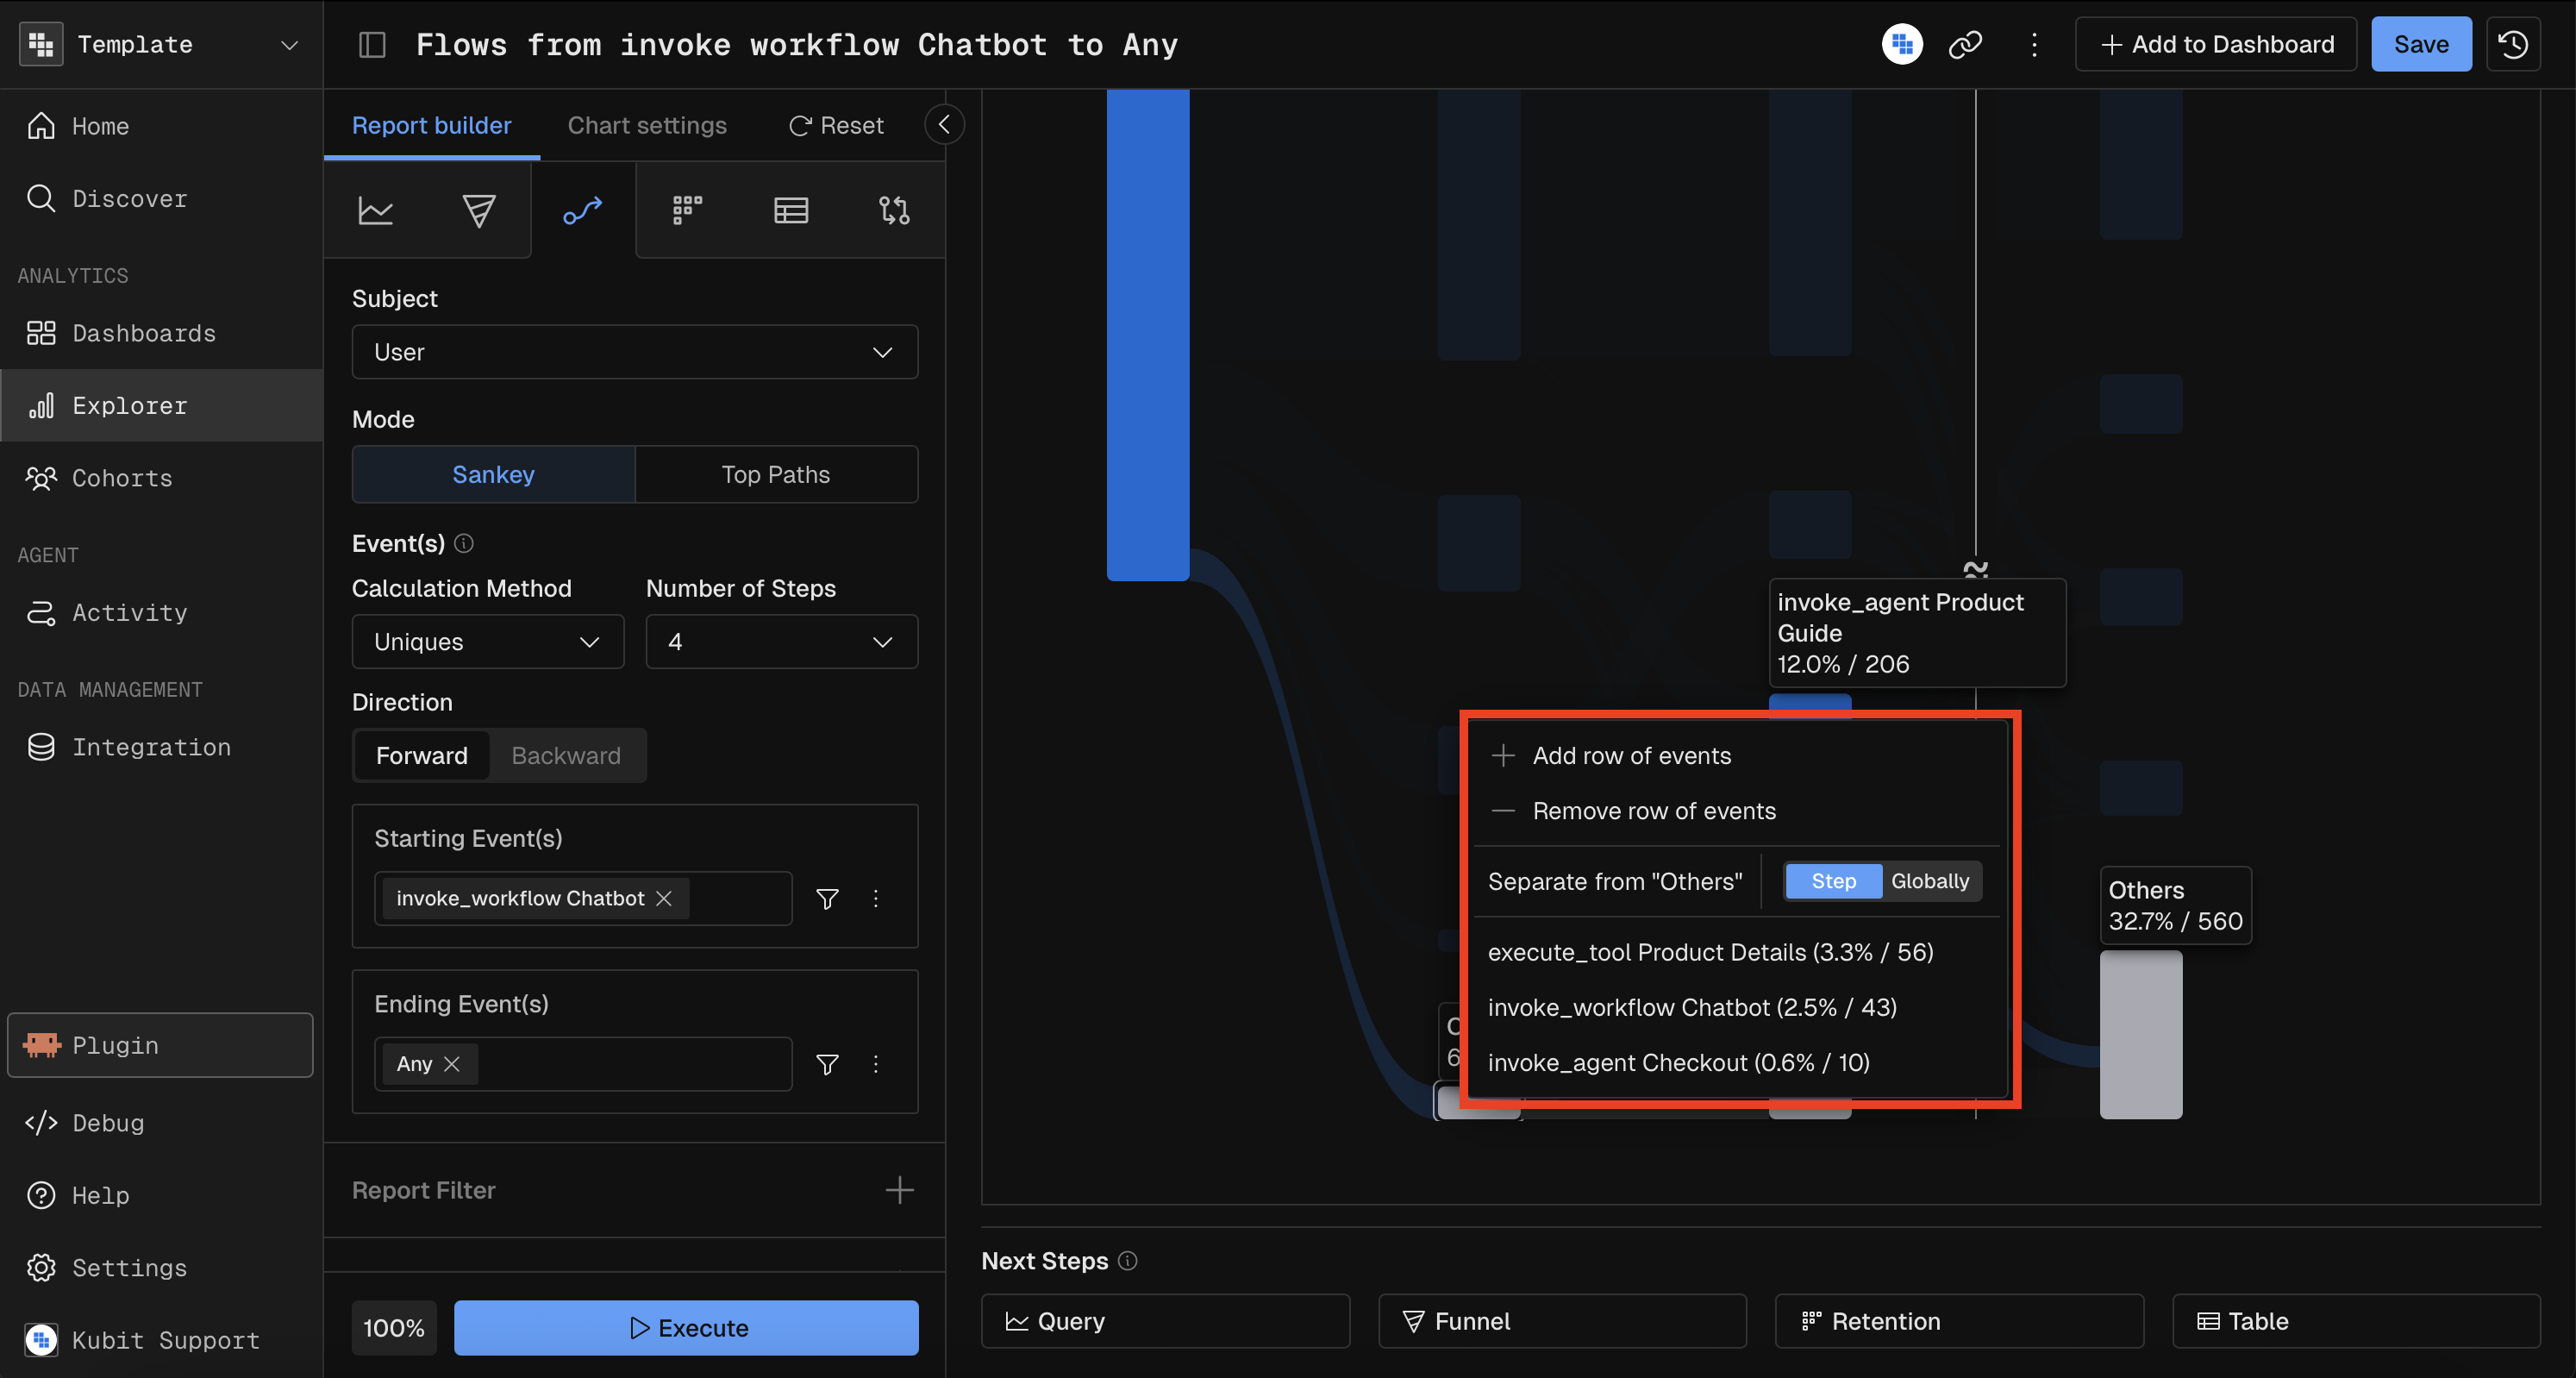
Others Node
By default we show Main Nodes with a significant number of users, we bucket the next group into an 'Other' node. This has less popular events and can be expanded if you need more details.
Left click on the Other Node and either "Add Row of events" or select the specific event you want to take out of 'Other'.
Drop Off Node
This node communicates the % and absolute number of users who did not perform any more events after the previous step. This can be interpreted as they bounced from the experience entirely.
Drop Off will be the solid black node and visible at the bottom of each step of the Flow. We also display a final Drop Off node beneath the final conversion event. The number in the final Drop Off node represents users who never achieved the Ending Event in the timeframe of the Flow.
What if the step has no Drop Off node?
This means that no users were lost on this step. It's not uncommon but shouldn't occur often as users can exist experiences at anytime most often.
Prompting Kubit Through MCP
When using Kubit through MCP, you create Flow reports by describing the starting or ending event and what journey you want to explore. The MCP server translates your request into the appropriate flow configuration.
Effective Prompts
A good Flow prompt specifies:
Direction — forward ("from [event]") or backward ("to [event]")
Starting or ending event — the anchor point of the flow
Subject (if not User) — what entity to track
Date range — the time window
Max steps (if not default) — how deep to trace the journey
Display mode (if not Sankey) — "top paths" for a ranked list
Examples by Complexity
Simple — forward flow from an event:
"Show me a flow from user prompt over the last 7 days"
Medium — backward flow with breakdown:
"What events lead to a checkout error? Show me a backward flow to 'checkout_error', broken down by platform"
Advanced — specific steps and adjustments:
"Create a forward flow from intent classification with 6 steps, counting unique traces, for the last 30 days"
Specialized — top paths view:
"List the top paths users take from search to purchase over the last 14 days"
Tips
Say "from [event]" for forward flows and "to [event]" or "leading to [event]" for backward flows.
Default direction is Forward if not specified.
Say "top paths" to switch from Sankey to the ranked path list.
Max steps defaults to 4. Say "with N steps" to override (range: 2–15).
Flow does not support Compare — use a date range filter to isolate time periods instead.