Anomaly Detection
Auto Detection
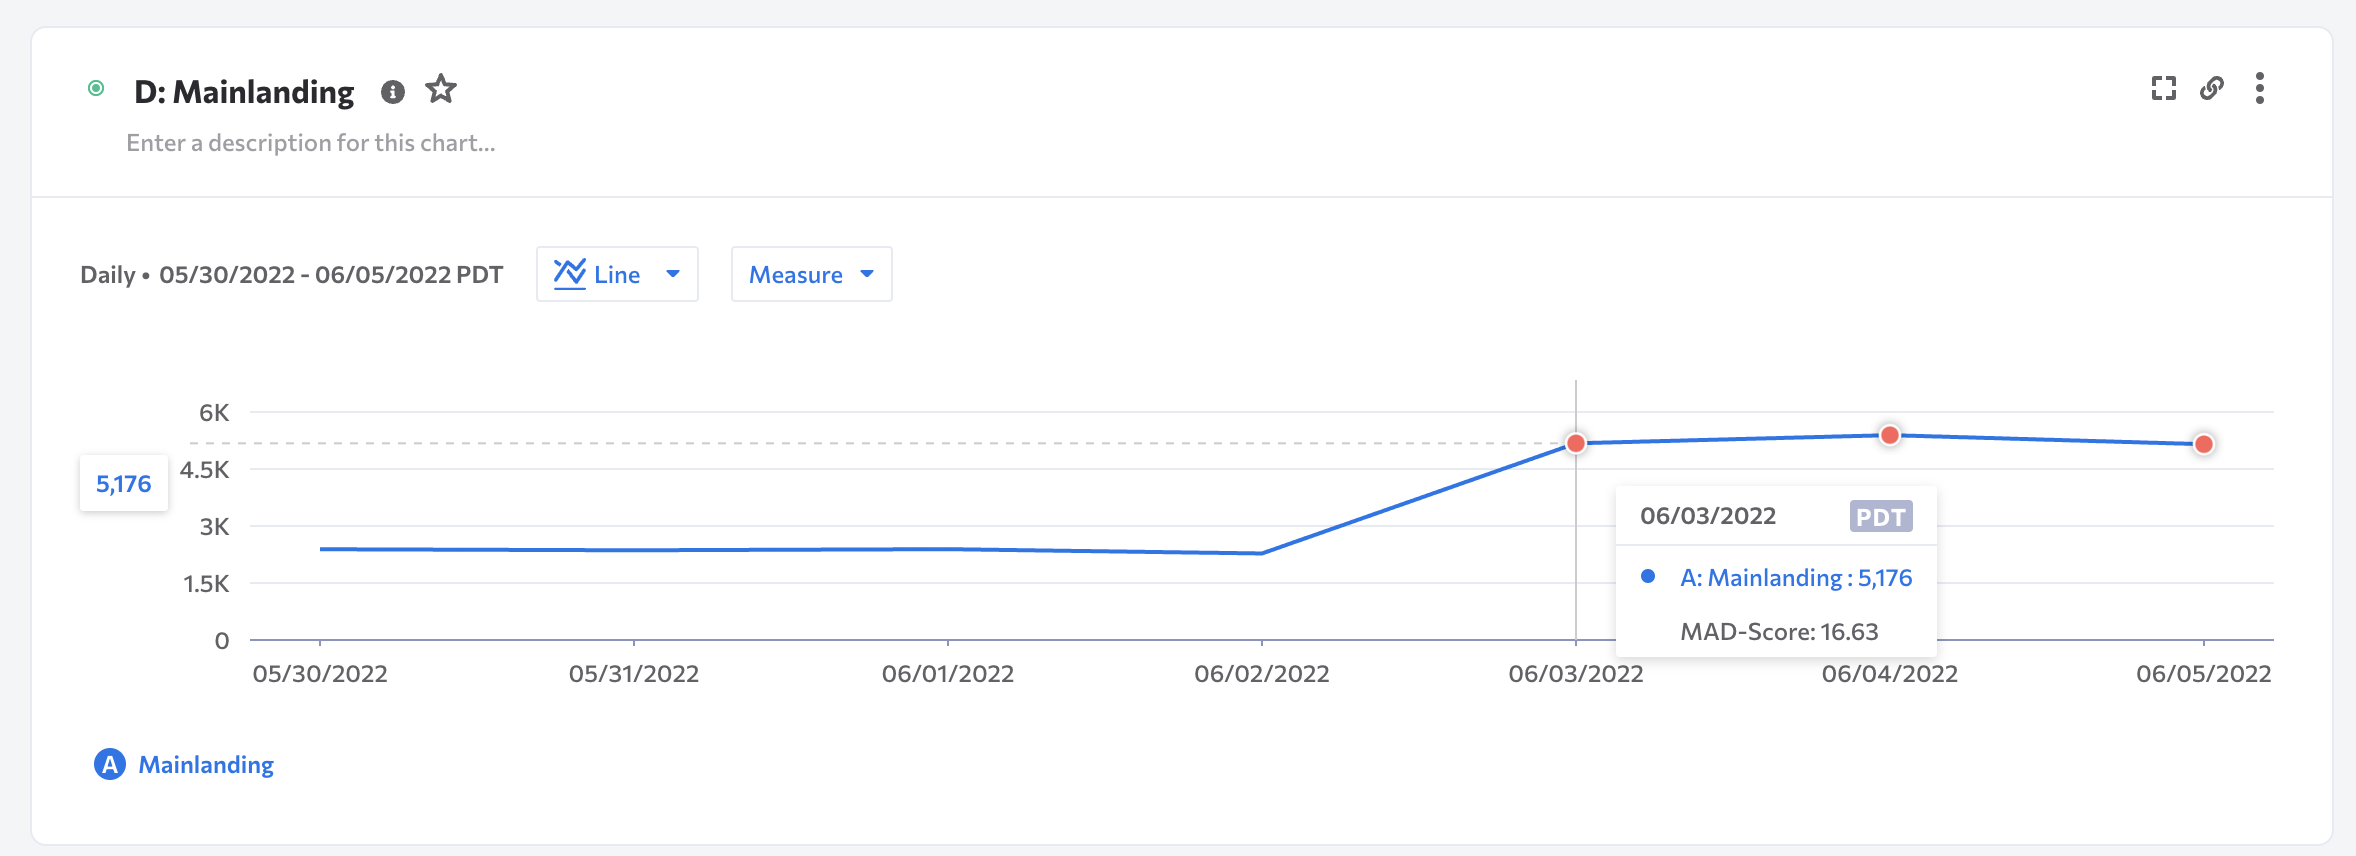
For every time series analysis, Kubit's anomaly detection engine automatically calls out outliers as red dots on the chart.
Behind the scenes, a machine learning model based on historical data that considers seasonalities, skips known incidents, and reduces false alarms.
Mouse-over shows the Z-score or MAD score of the incident data points compared to the predicted values.
Here is a helpful guide on how to interpret the values.
The Z-score measures how far a point is away from the mean (average); large absolute values of the Z-score suggest an anomaly. So, the further away from
0the more severe the anomaly, both positive and negative.MAD stands for median absolute deviation from the median. So, in contrast, rather than using the mean, the MAD score uses the median. This helps smooth out the anomalies in the data set that may skew up the mean and result in a less impactful anomaly.
Kubit will display the score that triggered the anomaly so you're sure to know how we came to the finding.
Anomaly detection not applied to all report types
Anomaly Detection is applied only to line charts such as Query or Funnel. One chart can contain multiple anomalies.
AI Detection
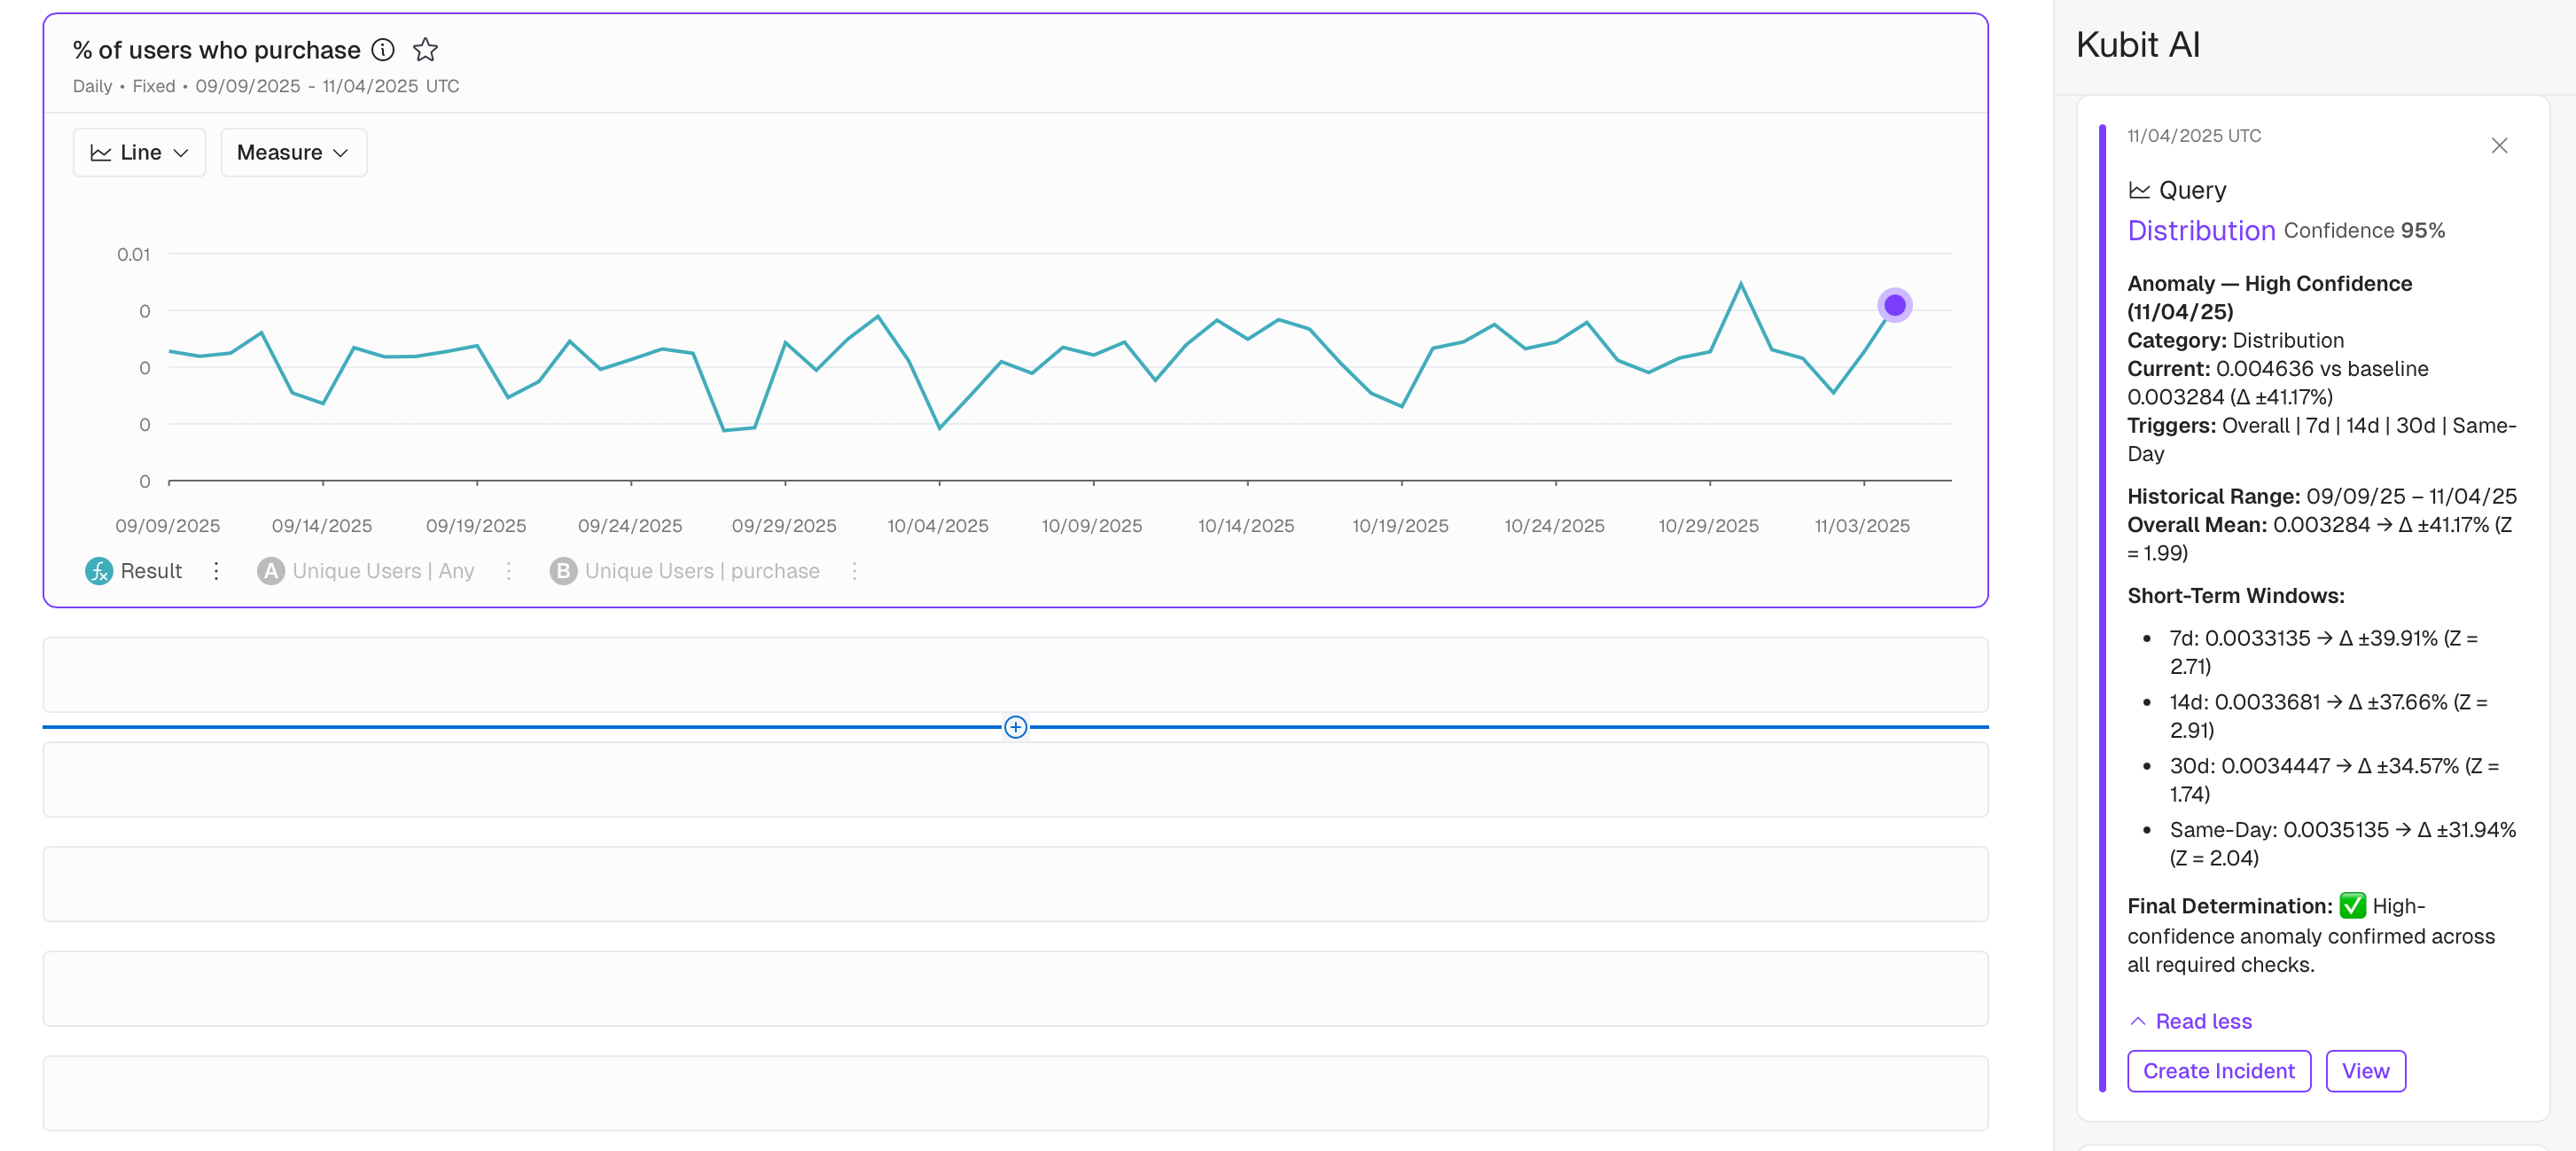
When requested, an AI model calls out outliers as purple dots on the chart based on historical data that considers seasonalities, skips known incidents, and reduces false alarms.
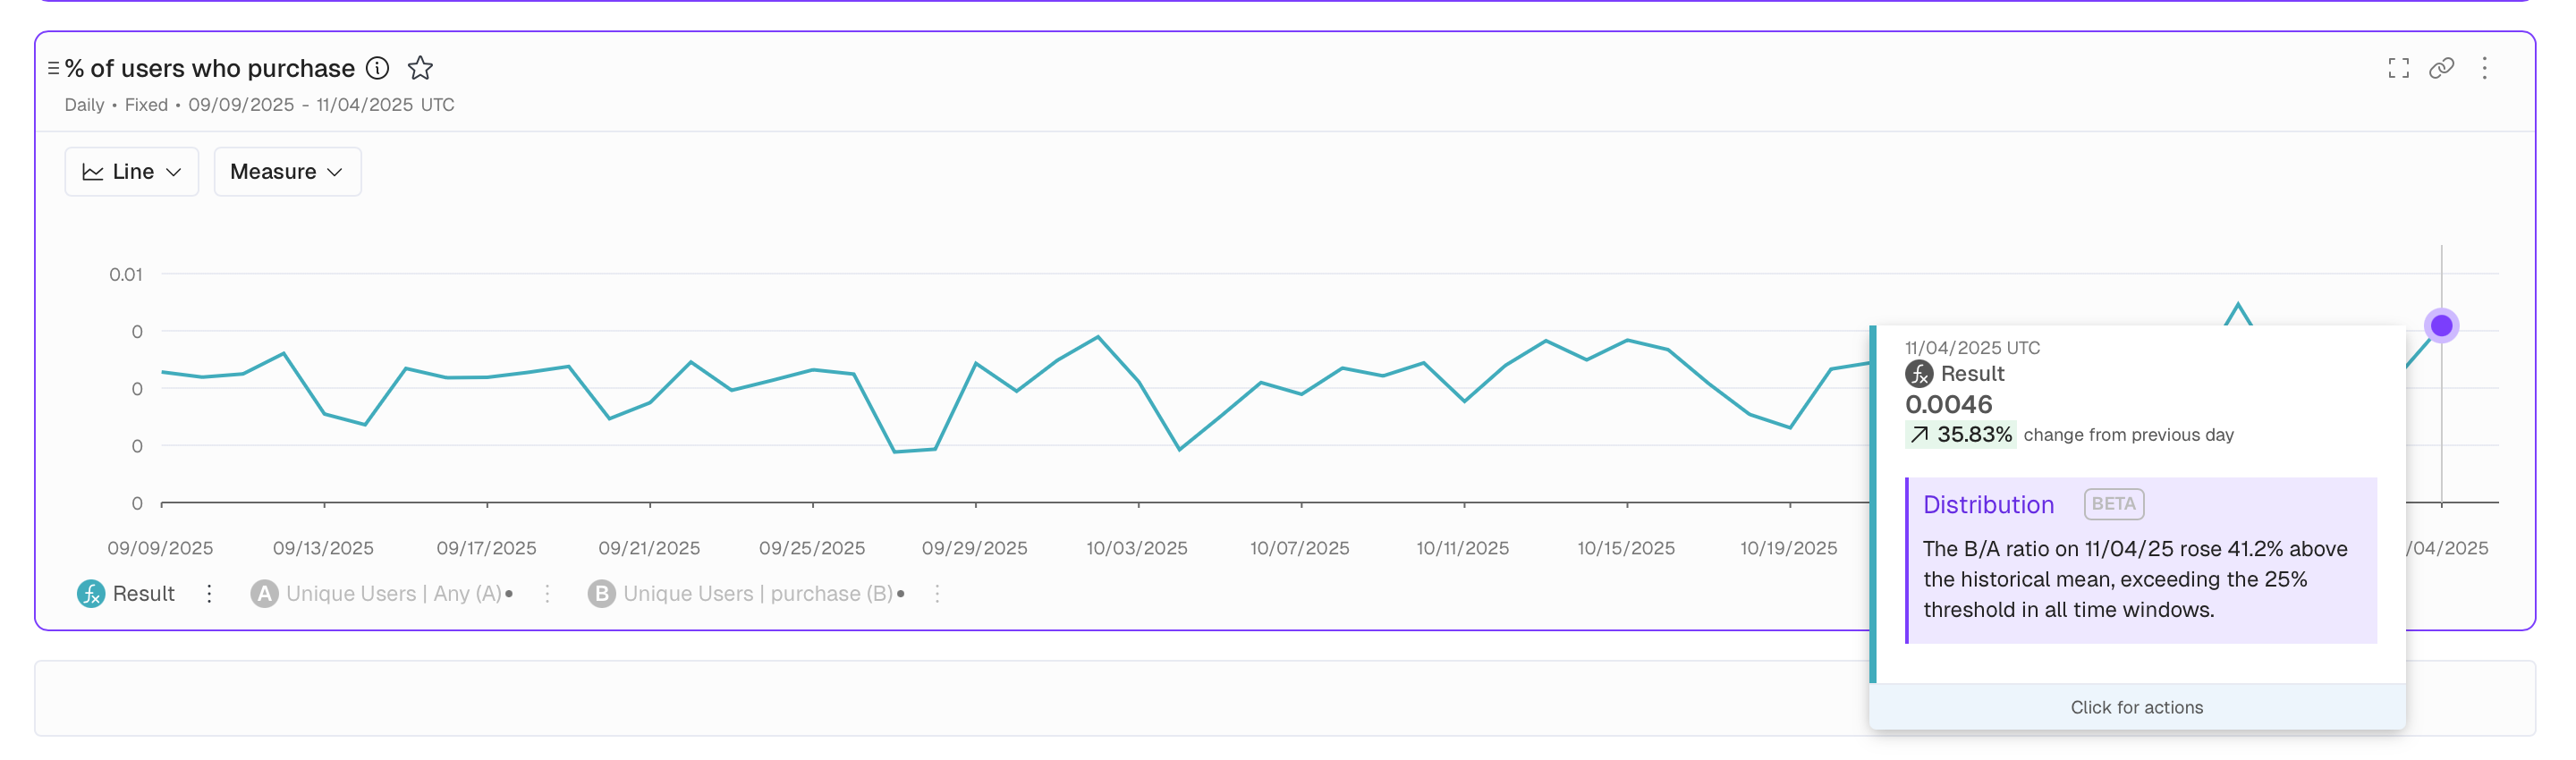
There's 3 types, or categories, of anomalies detected by Kubit:
Volume: Abnormal record counts
Distribution: Abnormal values in comparison with historical patterns
Freshness: Missing or delayed data
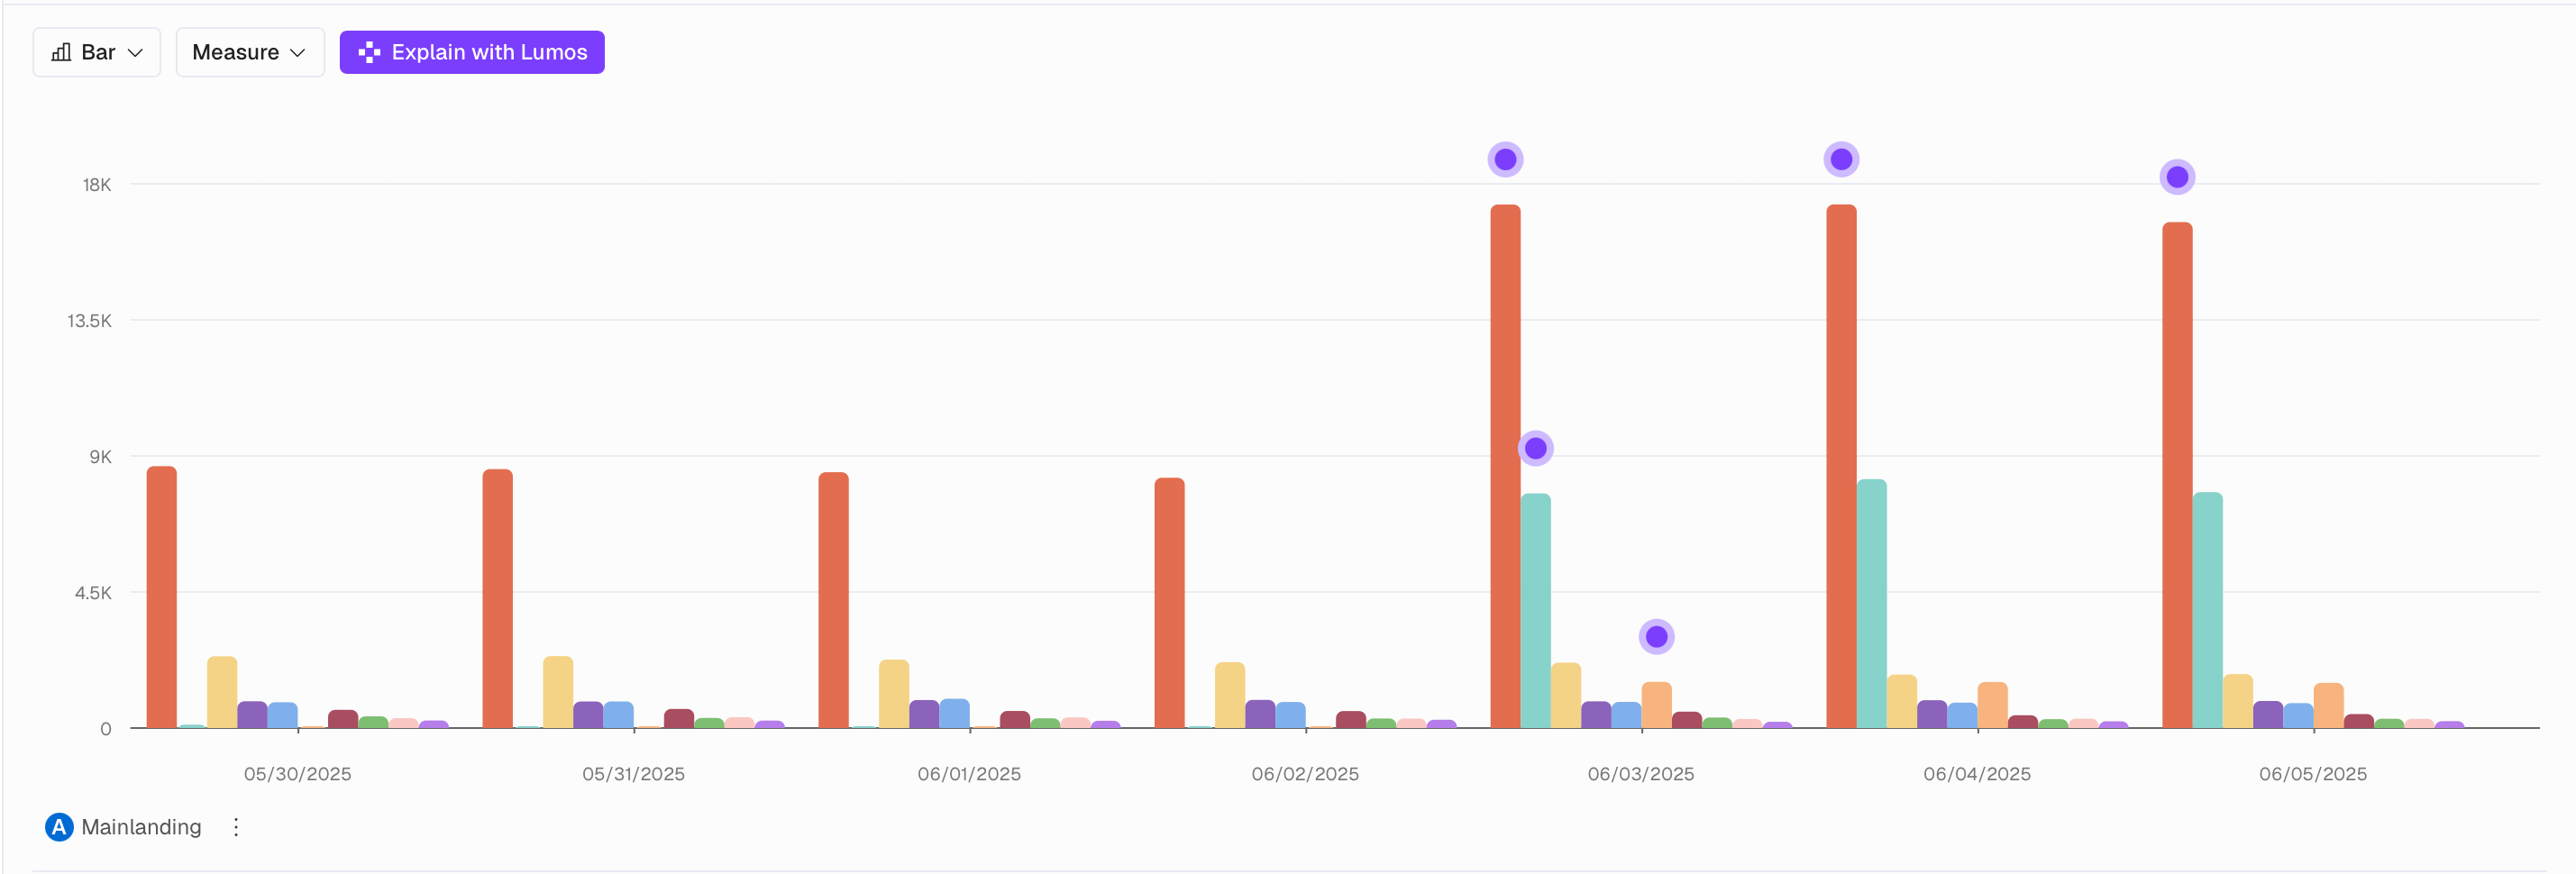
Anomalies are displayed for the following report types:
Query
Funnel (when
Mode: Conversion)
and even when there is a Breakdown applied:
What constitutes an Anomaly?
When deciding whether a data point is an Anomaly Kubit is considering not only all the data contained in the Report but also:
7, 14 and 30 day means, same day of week mean (for Reports with
Time Unit = Daily)for
Incrementalschedules all the Historical data is also taken into consideration when detecting an Anomaly for the new increment (see more about Incremental Mode here)
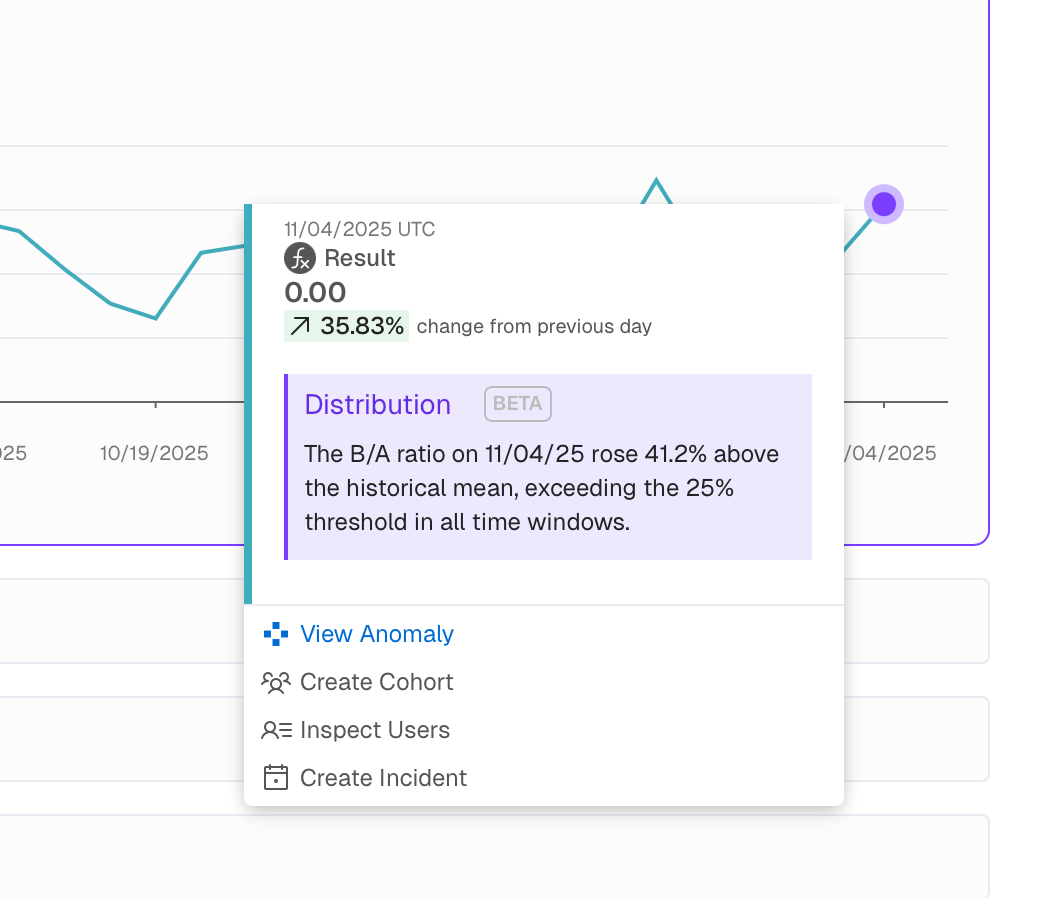
You can get a more detailed explanation on why a certain data point was considered an anomaly by left-clicking on the purple dot and then selecting View Anomaly. You will see parameters such as Confidence, Triggers and the MAD or Z-score.
Anomaly Detection Settings
Depending on the nature of your business we can further fine-tune how Anomalies are detected from by selecting the appropriate Detect mode for you:
Include only weekdays- can be selected in case your users' activity is during working days mostly (e.g. for enterprise software)Include all data- for everything else
If you think the wrong mode is being used, please contact support to make this change for you.
Detection Agent
What it does: Identifies anomalies or outliers in time series data. Runs full AI detection and leverages previously cached reports to gather enough historical data for valid anomaly detection.
How to describe it: "Detect scans your data for anything unusual—spikes, drops, or patterns that don't fit. A lightweight anomaly detection runs after each report is generated. You can then run the full AI detection if to confirm you have an anomaly. “
Example prompts:
"Are there any anomalies in this data?"
"Is there an issue with the data?"
"Run anomaly detection on my DAU report"