Dashboards
This guide covers how to create, configure, and share dashboards in Kubit: creating dashboards, adding and arranging content, filters, editing charts, dashboard settings, and sharing.
When to Use a Dashboard
A dashboard brings multiple reports together on a single page, giving you an at-a-glance view of the metrics that matter most. Use dashboards to monitor ongoing performance, share insights with your team, and tell a data story with charts, text, and media side by side.
Use Case | Example |
|---|---|
Operational monitoring | Combine KPIs for latency, error rate, and throughput into a single view refreshed throughout the day. |
Stakeholder reporting | Build a weekly summary dashboard with key conversion funnels, retention curves, and cost metrics for leadership. |
Investigation hub | Group related reports around a specific feature launch or incident for focused analysis. |
Onboarding & documentation | Mix charts with rich text explanations and embedded Loom walkthroughs to create self-service analytics guides. |
Scheduled delivery | Set up a dashboard to be delivered on a schedule so stakeholders receive updates without logging in. |
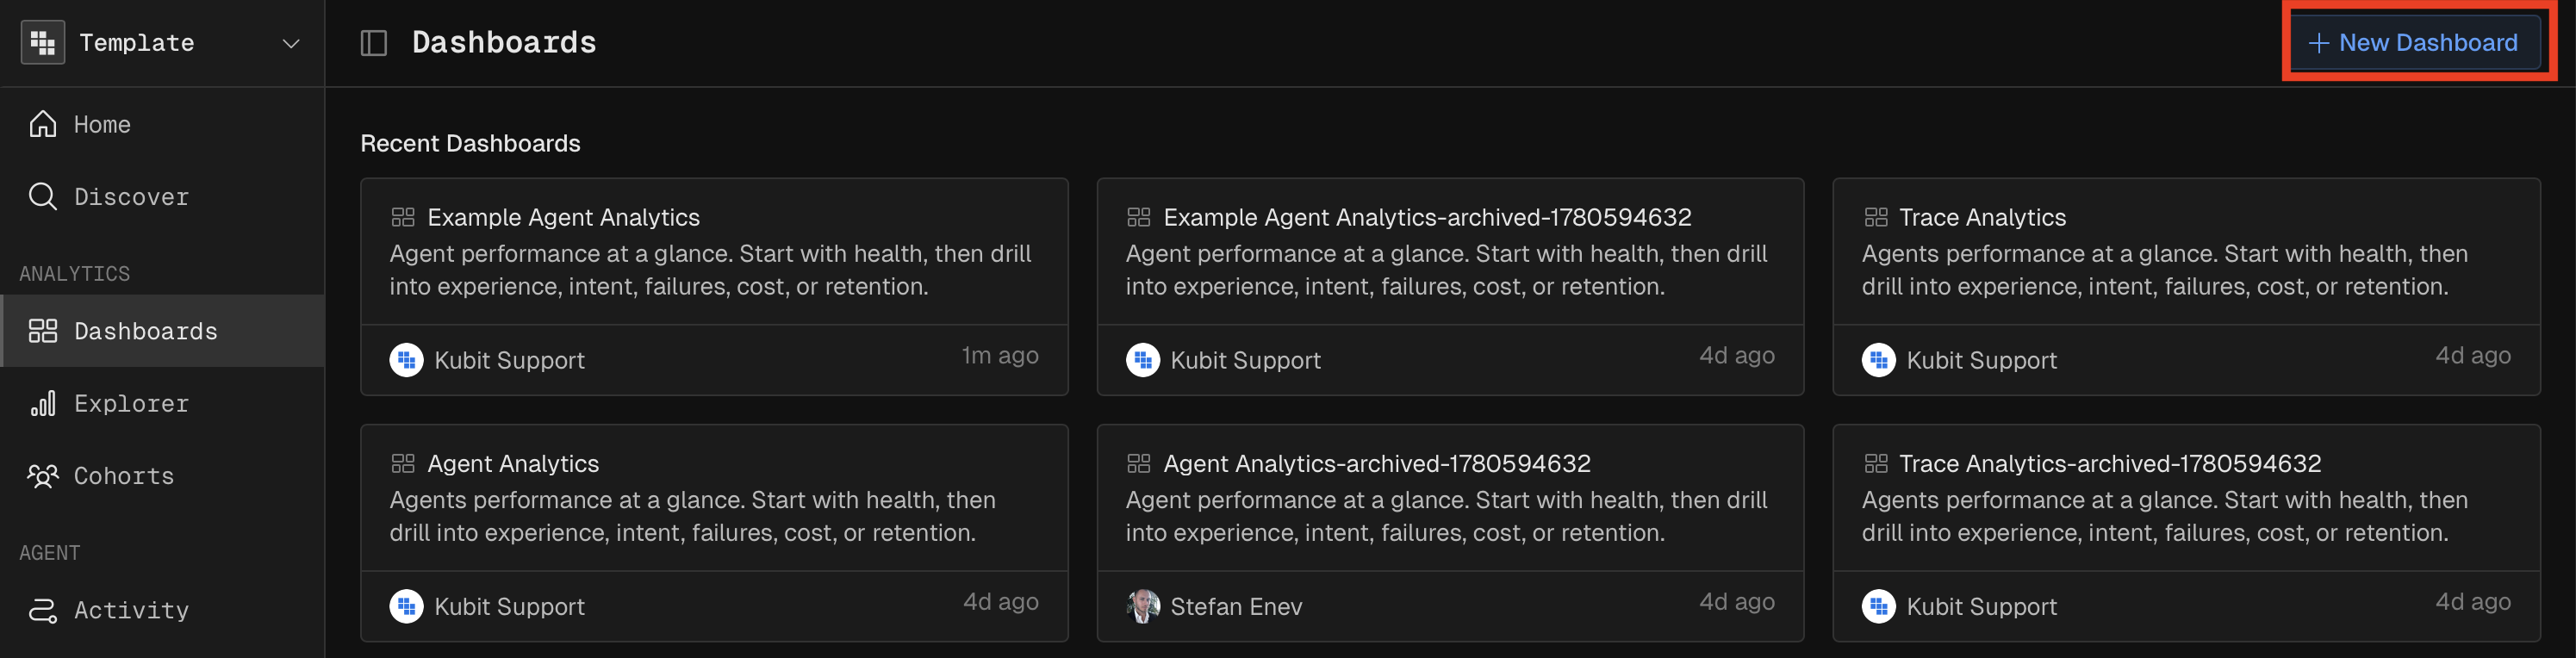
Creating a Dashboard
Create a new dashboard from the Dashboards page by clicking New Dashboard. A dashboard starts with a default name ("Untitled Dashboard") and an empty canvas. You can rename it and add a description immediately.
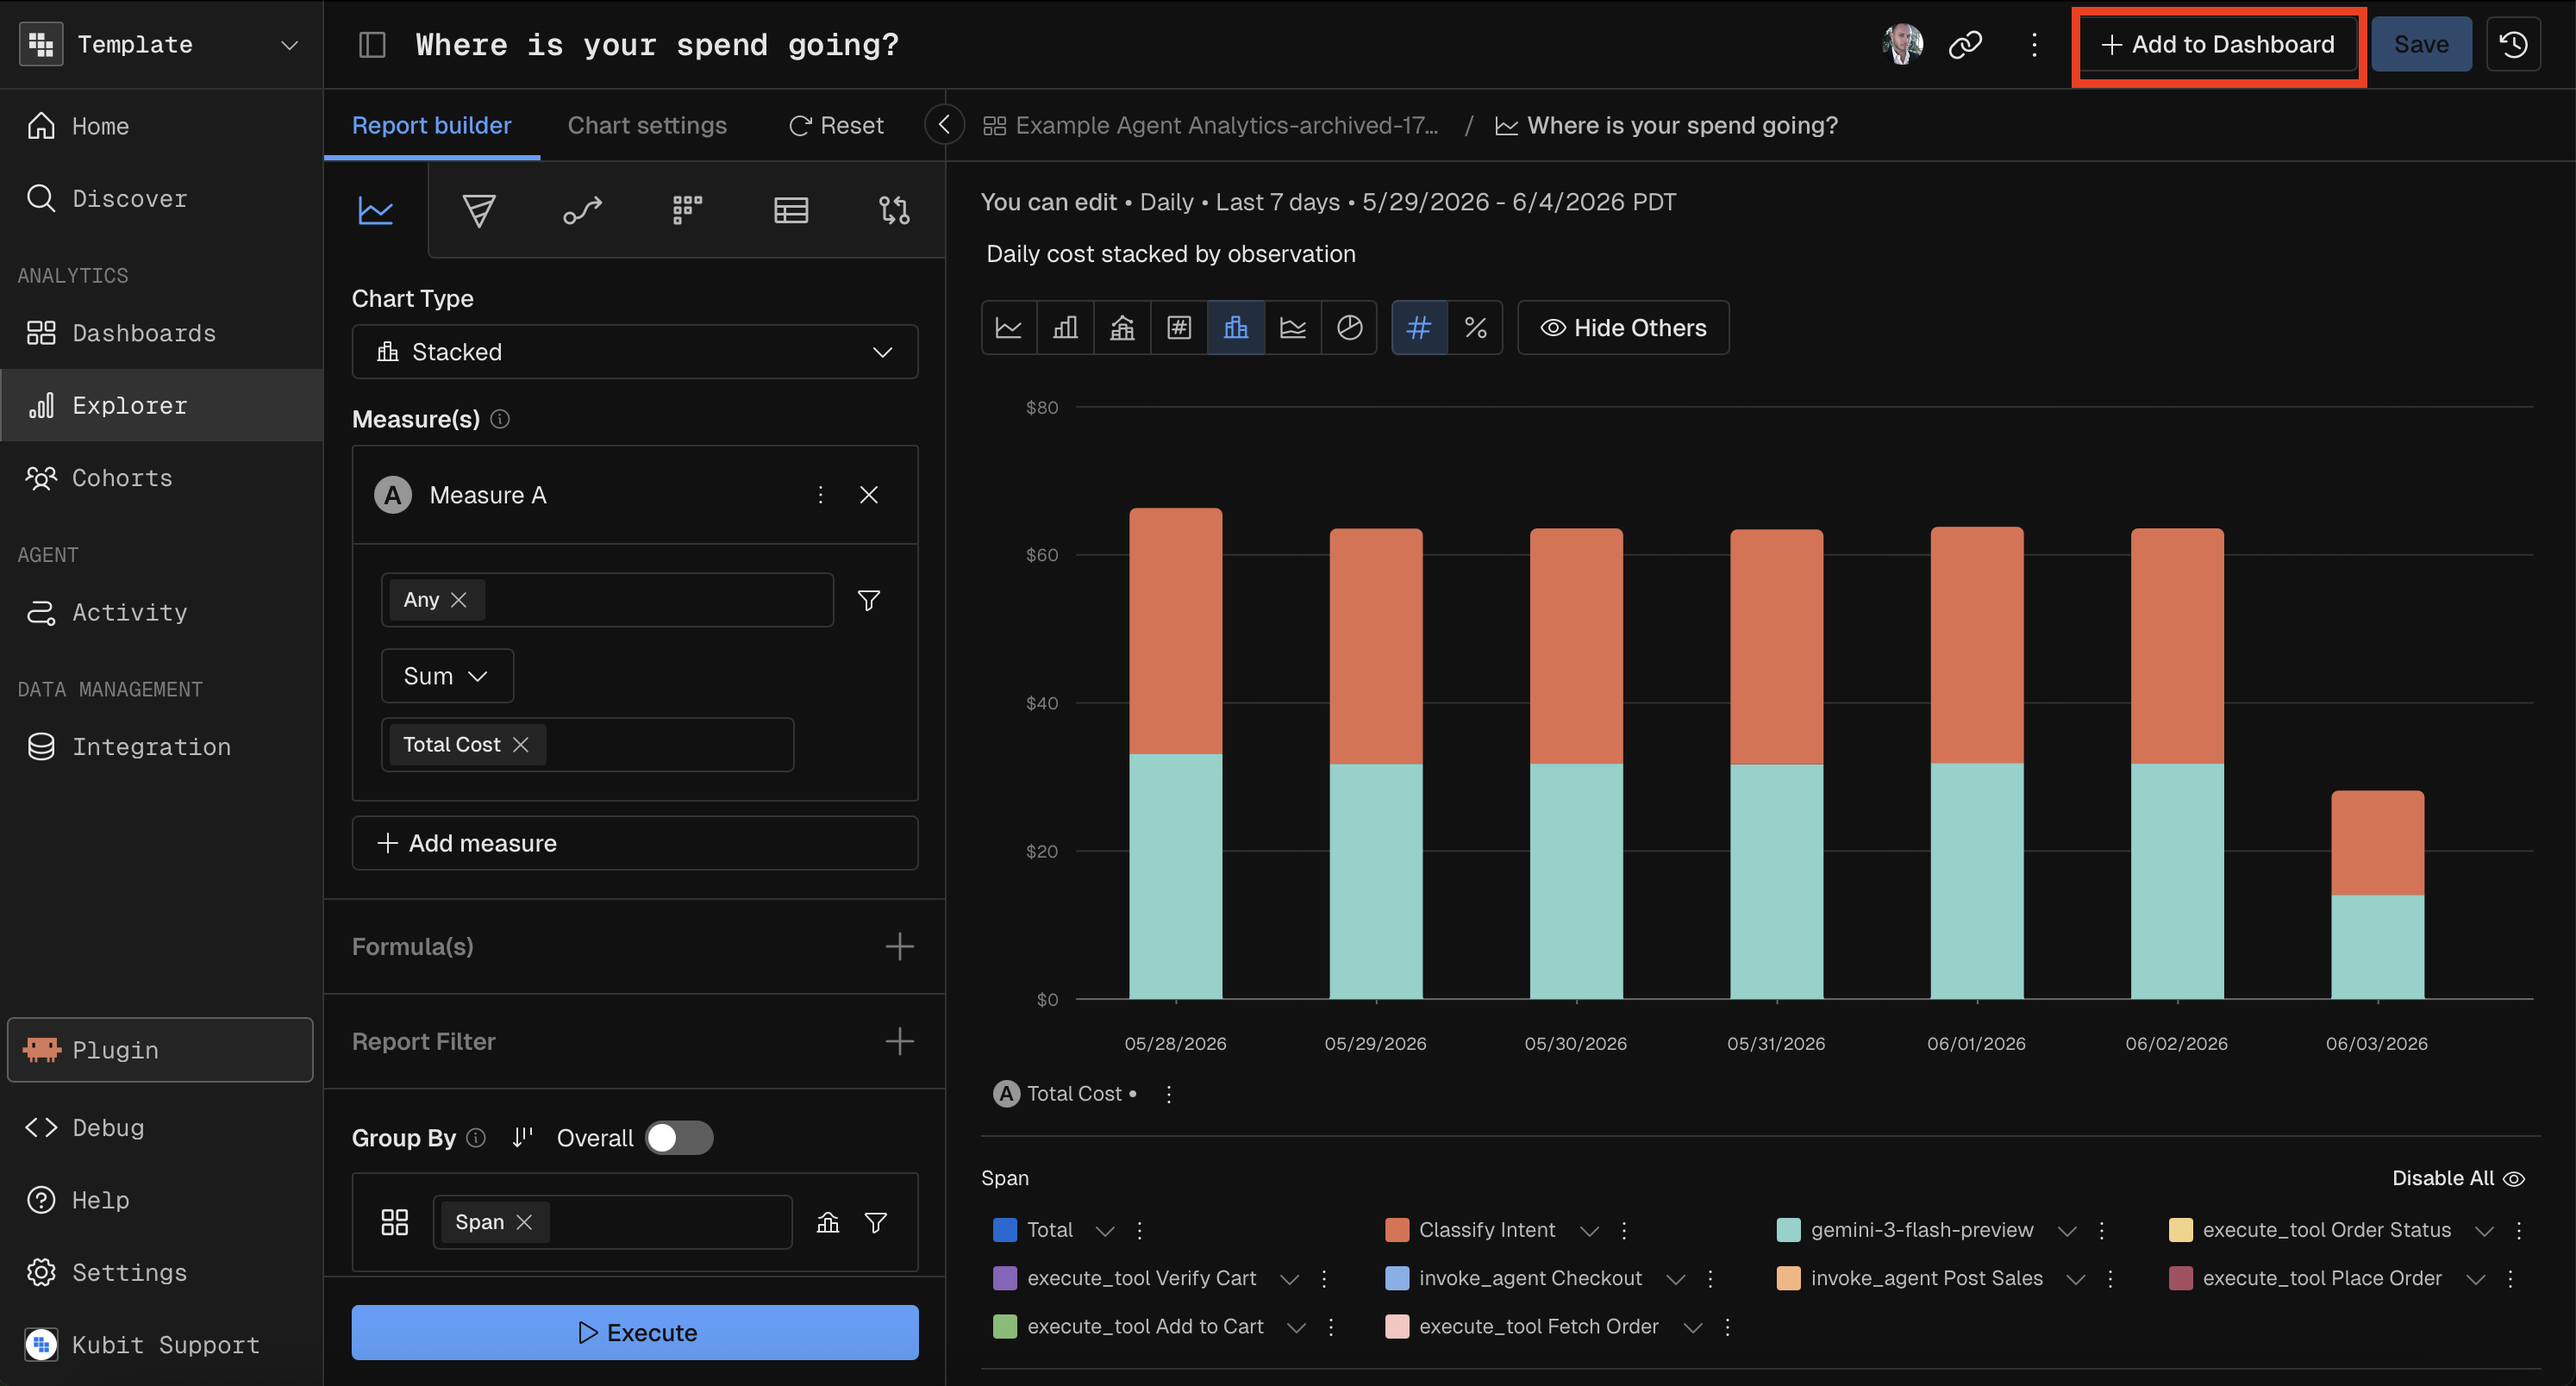
You can also create a dashboard on the fly when adding a report — the "Add to Dashboard" modal includes a New Dashboard option that creates one and adds the report in a single step.
Adding Content
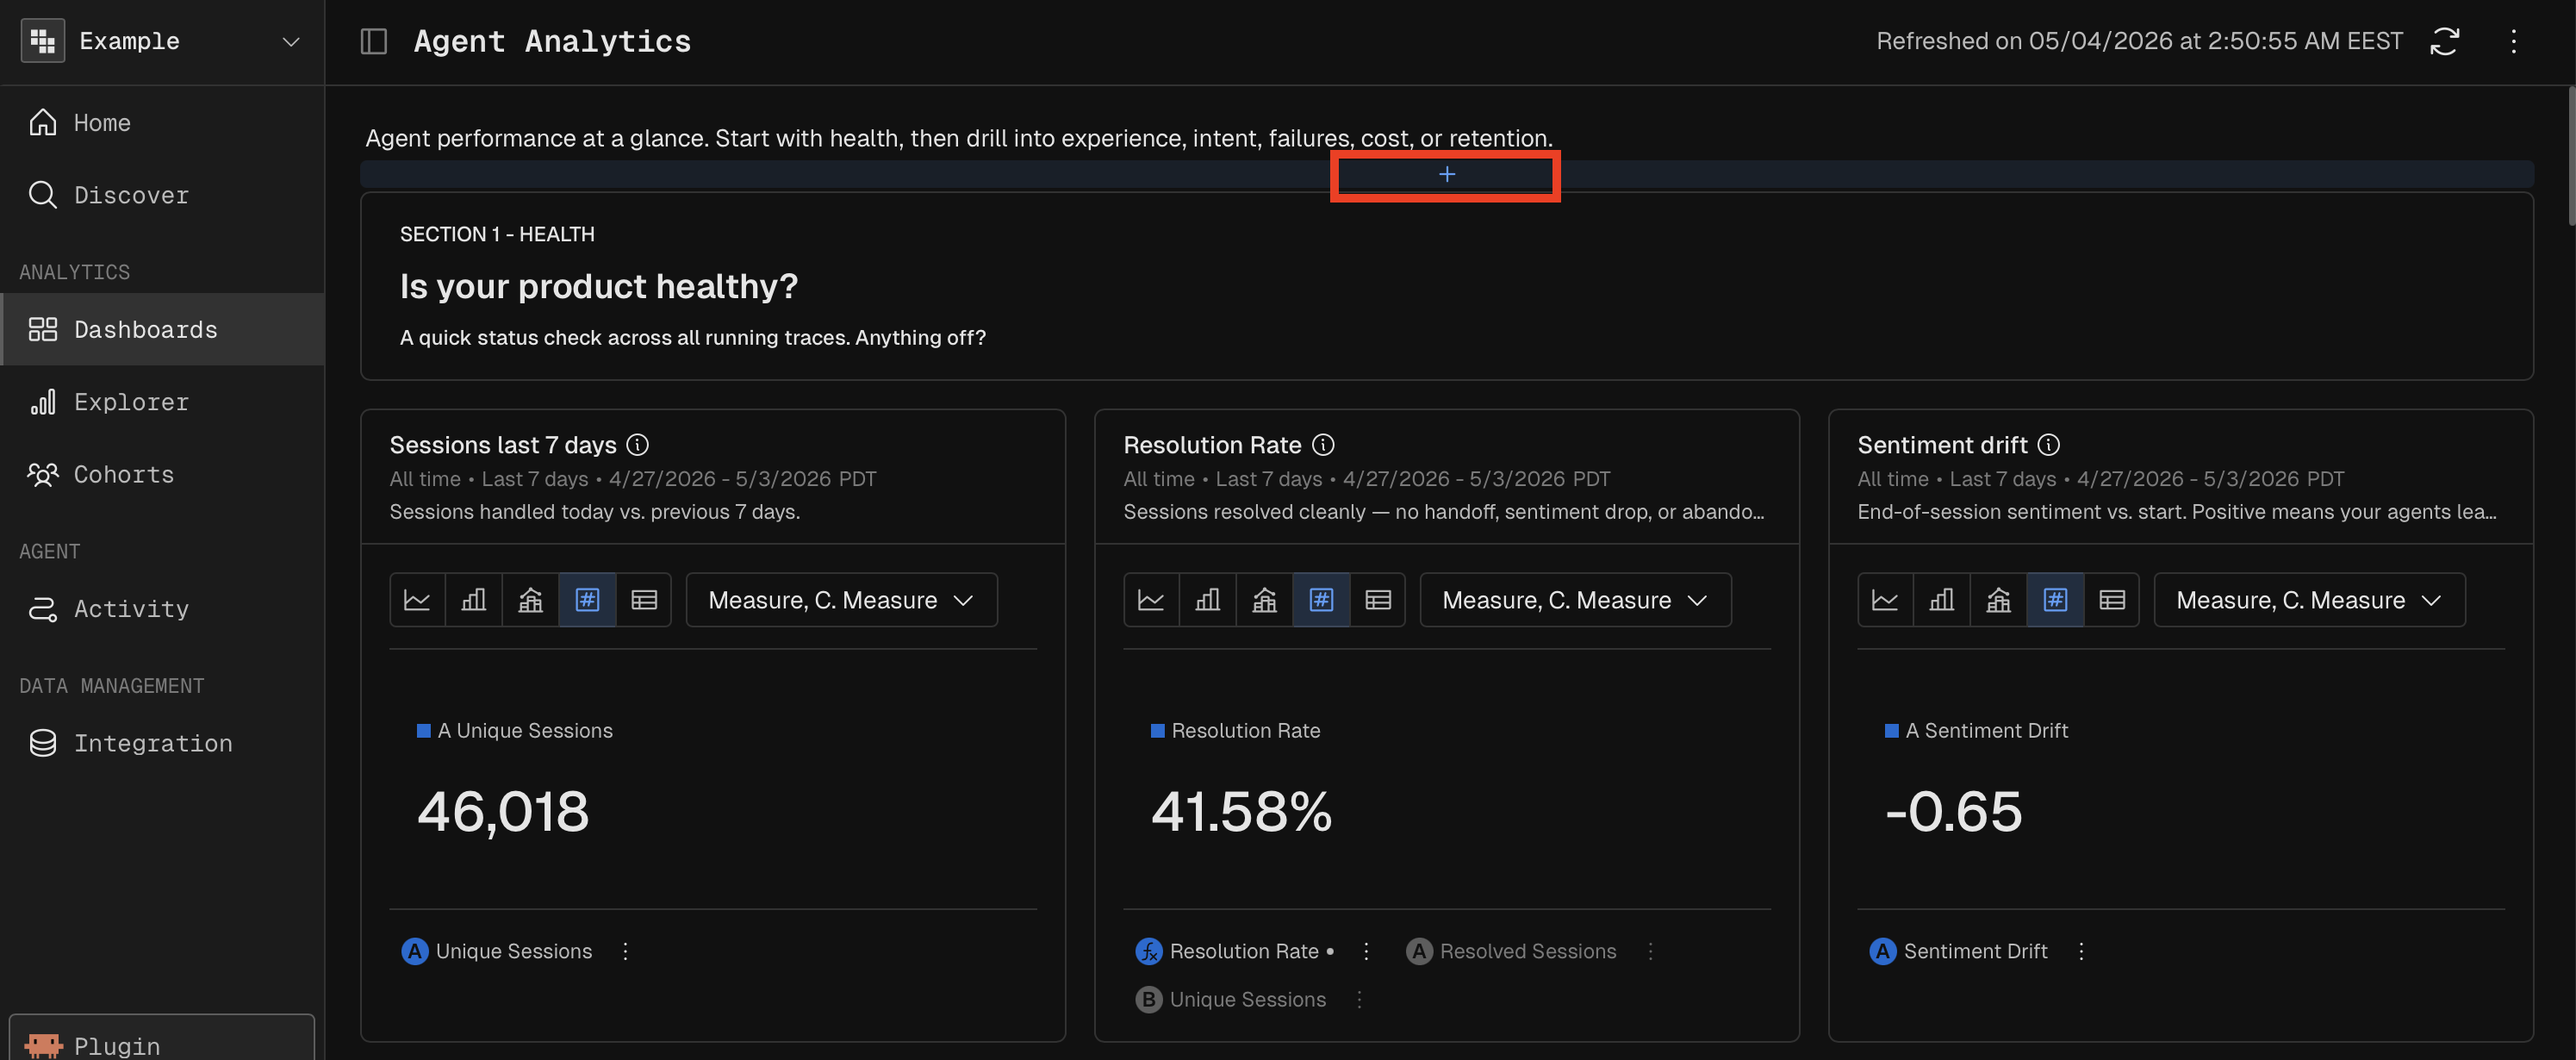
Dashboards support four content types. Use the + Add Content menu (visible in edit mode) to insert content at any position in the grid.
Reports
Add existing reports (Query, Funnel, Retention, Flow, Data Table, Significance) to the dashboard. Two entry points:
From a report: Click + Add to Dashboard in the report header, then select an existing dashboard or create a new one.
From the dashboard: Hover around the top just below Description and Click + Add Content → Existing Reports, search for and select the report to add.
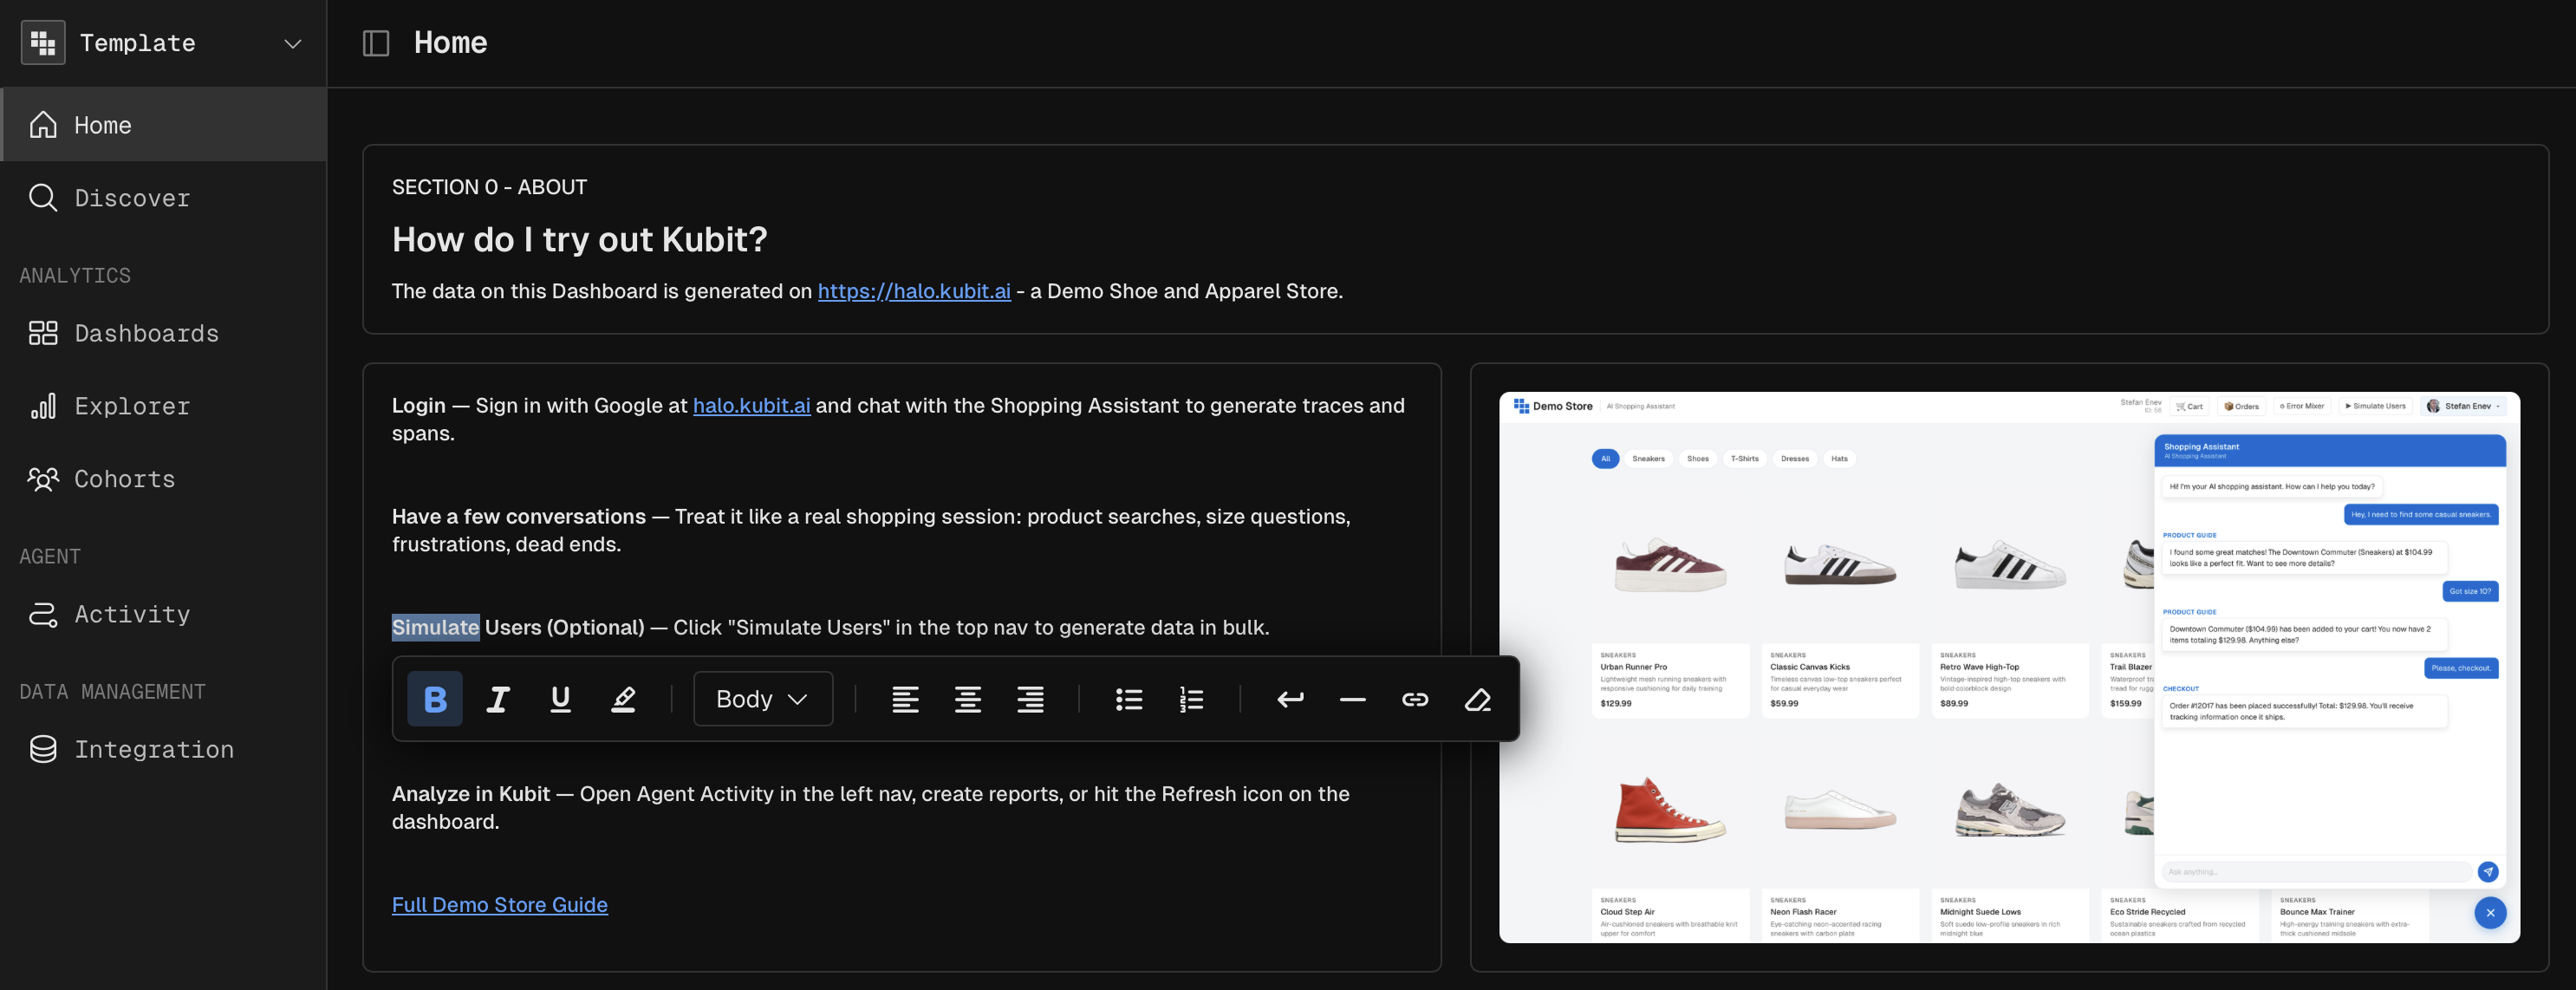
Rich Text
Add formatted text blocks for context, annotations, section headers, or instructions.
Supported formatting:
Feature | Details |
|---|---|
Headings | H1, H2, H3 |
Inline styles | Bold, Italic, Underline |
Text alignment | Left, Center, Right |
Highlighting | Background color for emphasis |
Links | Clickable URLs (open in new tab) |
Lists | Ordered and unordered |
Typography | Smart quotes and dashes auto-formatted |
Rich text is edited inline — click the text block to enter edit mode, and changes save automatically when you click away.
Images
Upload an image file directly. The image is stored in the cloud and displayed at full width within its grid cell. Use images for screenshots, diagrams, architecture charts, or branding.
Media Embeds
Embed external video content by URL. Supported providers:
Provider | URL Pattern |
|---|---|
YouTube |
|
Loom |
|
The video renders as an embedded player within the dashboard cell.
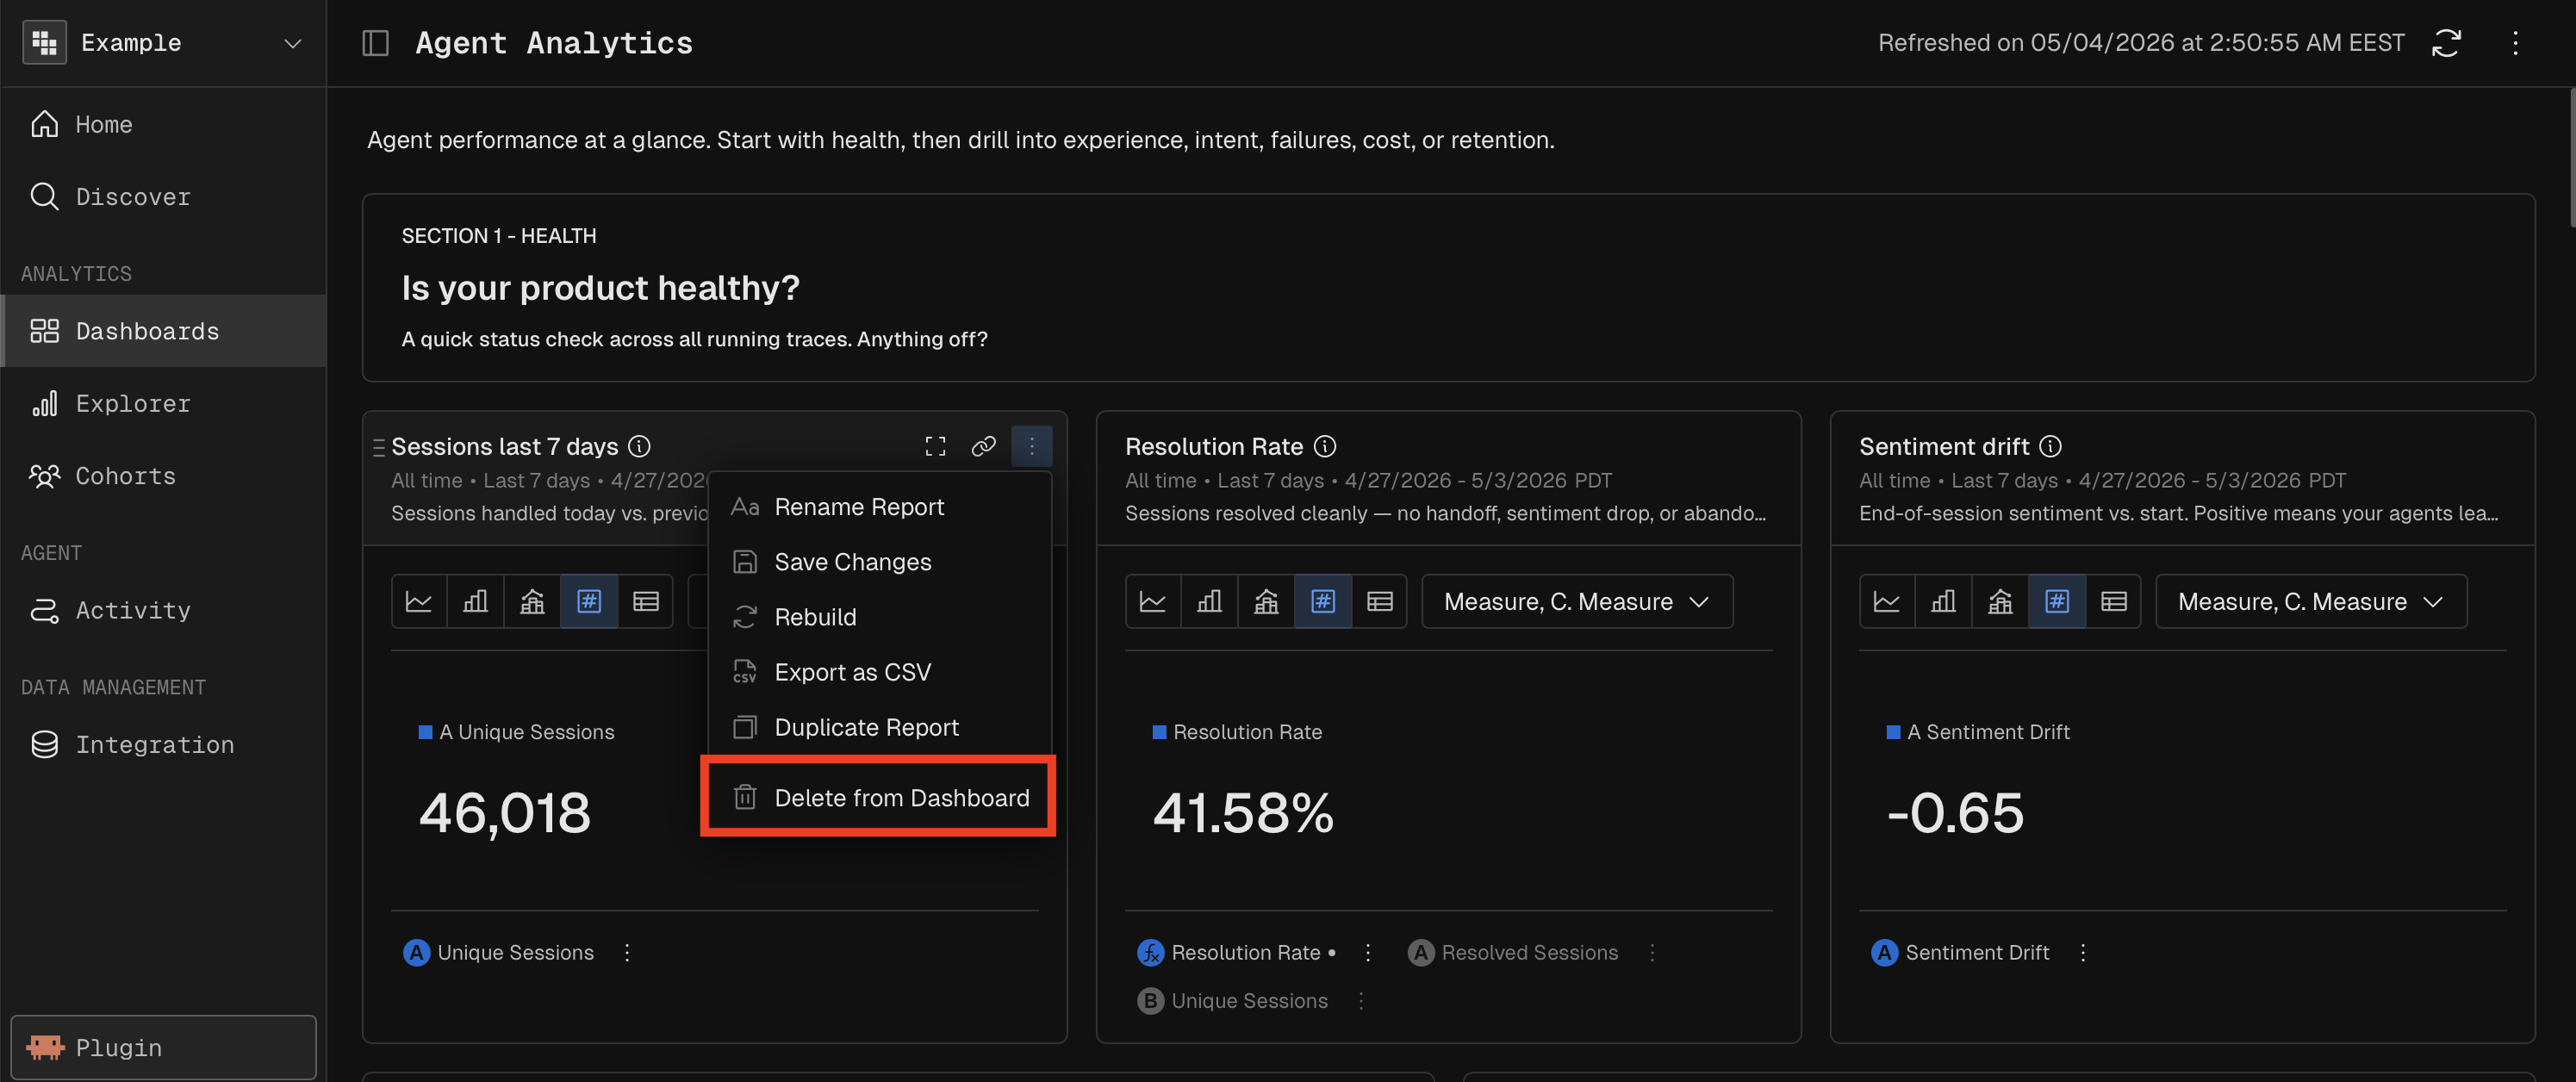
Removing Content
To remove any content from the dashboard, click the options menu (three-dot icon) on the cell and select Delete From Dashboard. The grid automatically rebalances column widths after removal. Empty rows are cleaned up automatically.
Layout
The dashboard uses a 12-column grid system. Content is arranged in rows, and each row can contain up to 3 cells. Cells within a row share the 12 columns proportionally.
Edit Mode vs View Mode
Mode | Capabilities |
|---|---|
Edit | Drag-and-drop reordering, column and row resizing, add/remove content, edit rich text, rename dashboard |
View | Read-only — all content is static, no editing controls visible |
Drag and Drop
In edit mode, grab a cell by its drag handle and move it to a new position. A drop preview shows where the cell will land. Cells can be moved within a row or between rows.
Resizing
Column width: Drag the border between two cells horizontally to resize their relative widths. Widths always sum to 12 columns per row.
Row height: Drag the bottom border of a row to set a minimum height.
Inserting at Specific Positions
Use the + buttons that appear on row and column borders to insert new content before, after, or between existing cells.
Editing and Replacing Charts
Charts on a dashboard are read-only views of their underlying reports. To modify a chart's query, measures, or configuration, you open the original report in the report builder.
Edit Workflow
Click the chart's title on the dashboard — this opens the report in the report builder.
Make your changes in the report builder and re-execute the report.
A banner appears: "Your report has been re-executed, would you like to replace it in {Dashboard Name}?"
Click Replace to update the dashboard with the new version, or dismiss to keep the previous version.
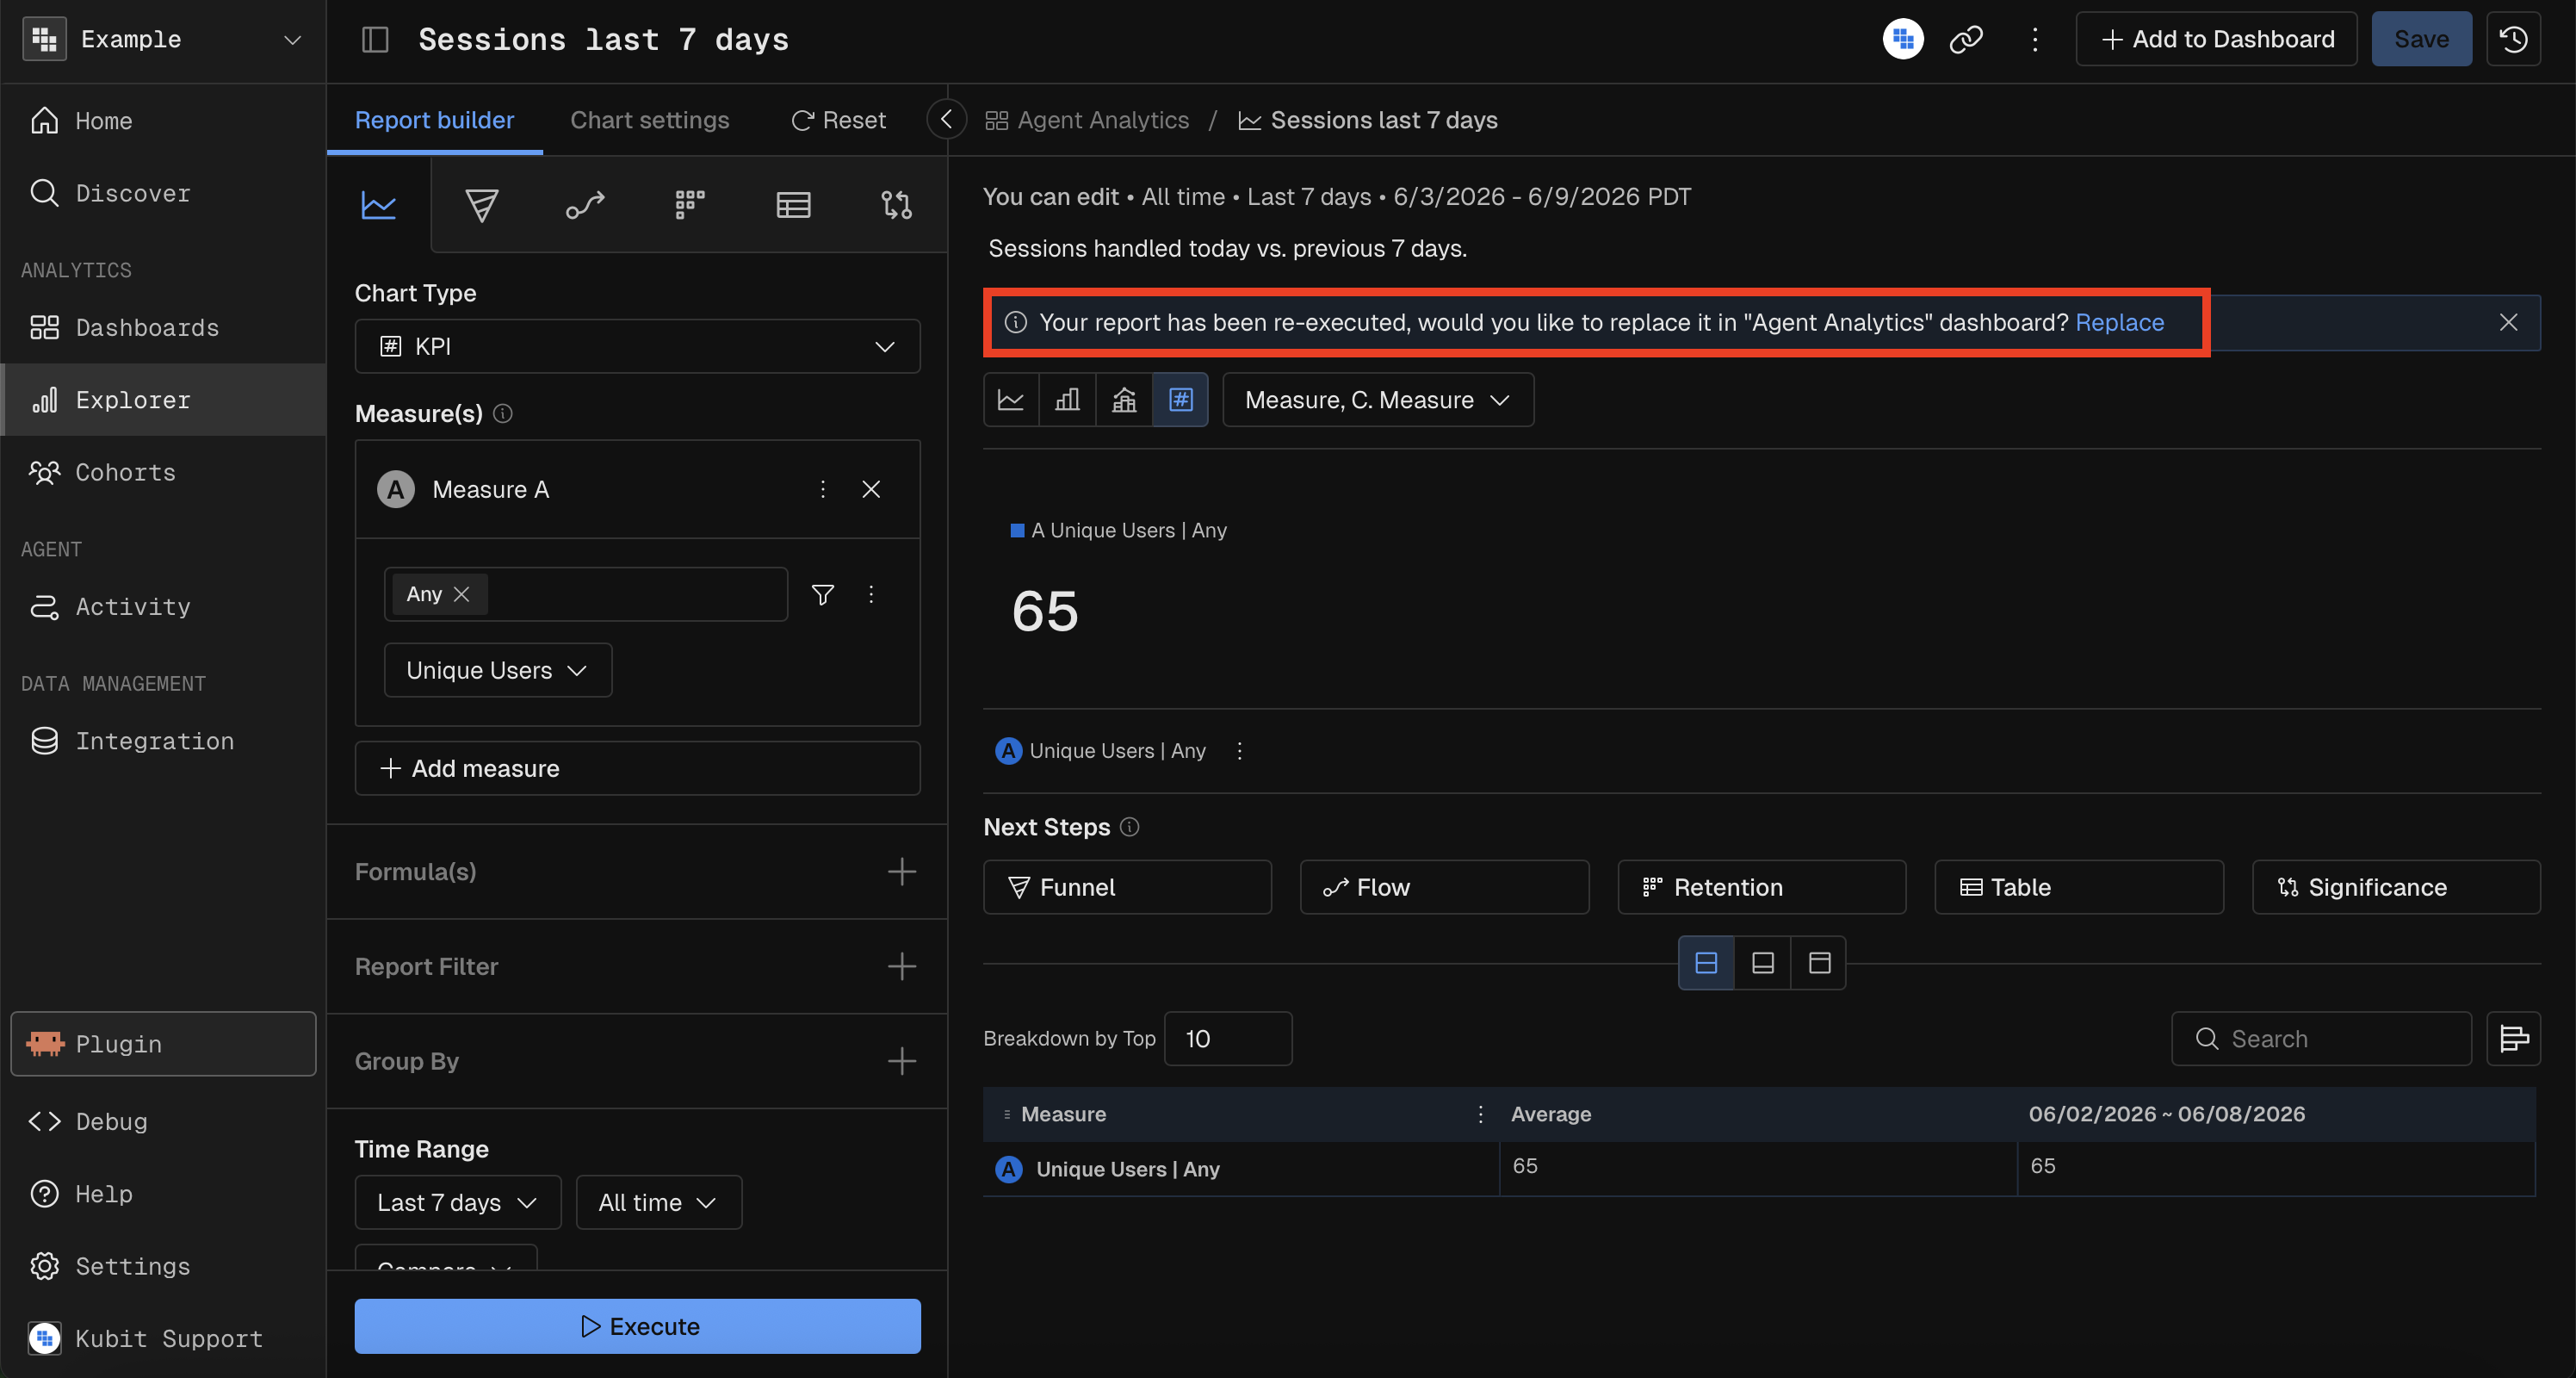
This two-step confirmation prevents accidental changes to shared dashboards.
Chart Options Menu
Each chart cell has an options menu (three-dot icon) with context-dependent actions:
Action | Description |
|---|---|
Duplicate Report | Create a copy of the report |
Rename Report | Change the report's display name |
Save Changes | Persist modifications to the report |
Rebuild | Re-execute the report with current parameters |
Export as CSV | Download the report data |
Delete from Dashboard | Remove the chart from this dashboard |
Available actions depend on your permissions and the report's current state.
Dashboard Settings
Refresh
Manually refresh all reports on the dashboard by clicking the refresh icon in the dashboard header. The header shows the timestamp of the last refresh.
When an incremental schedule is active (see Schedules below), an alarm icon appears next to the refresh timestamp.
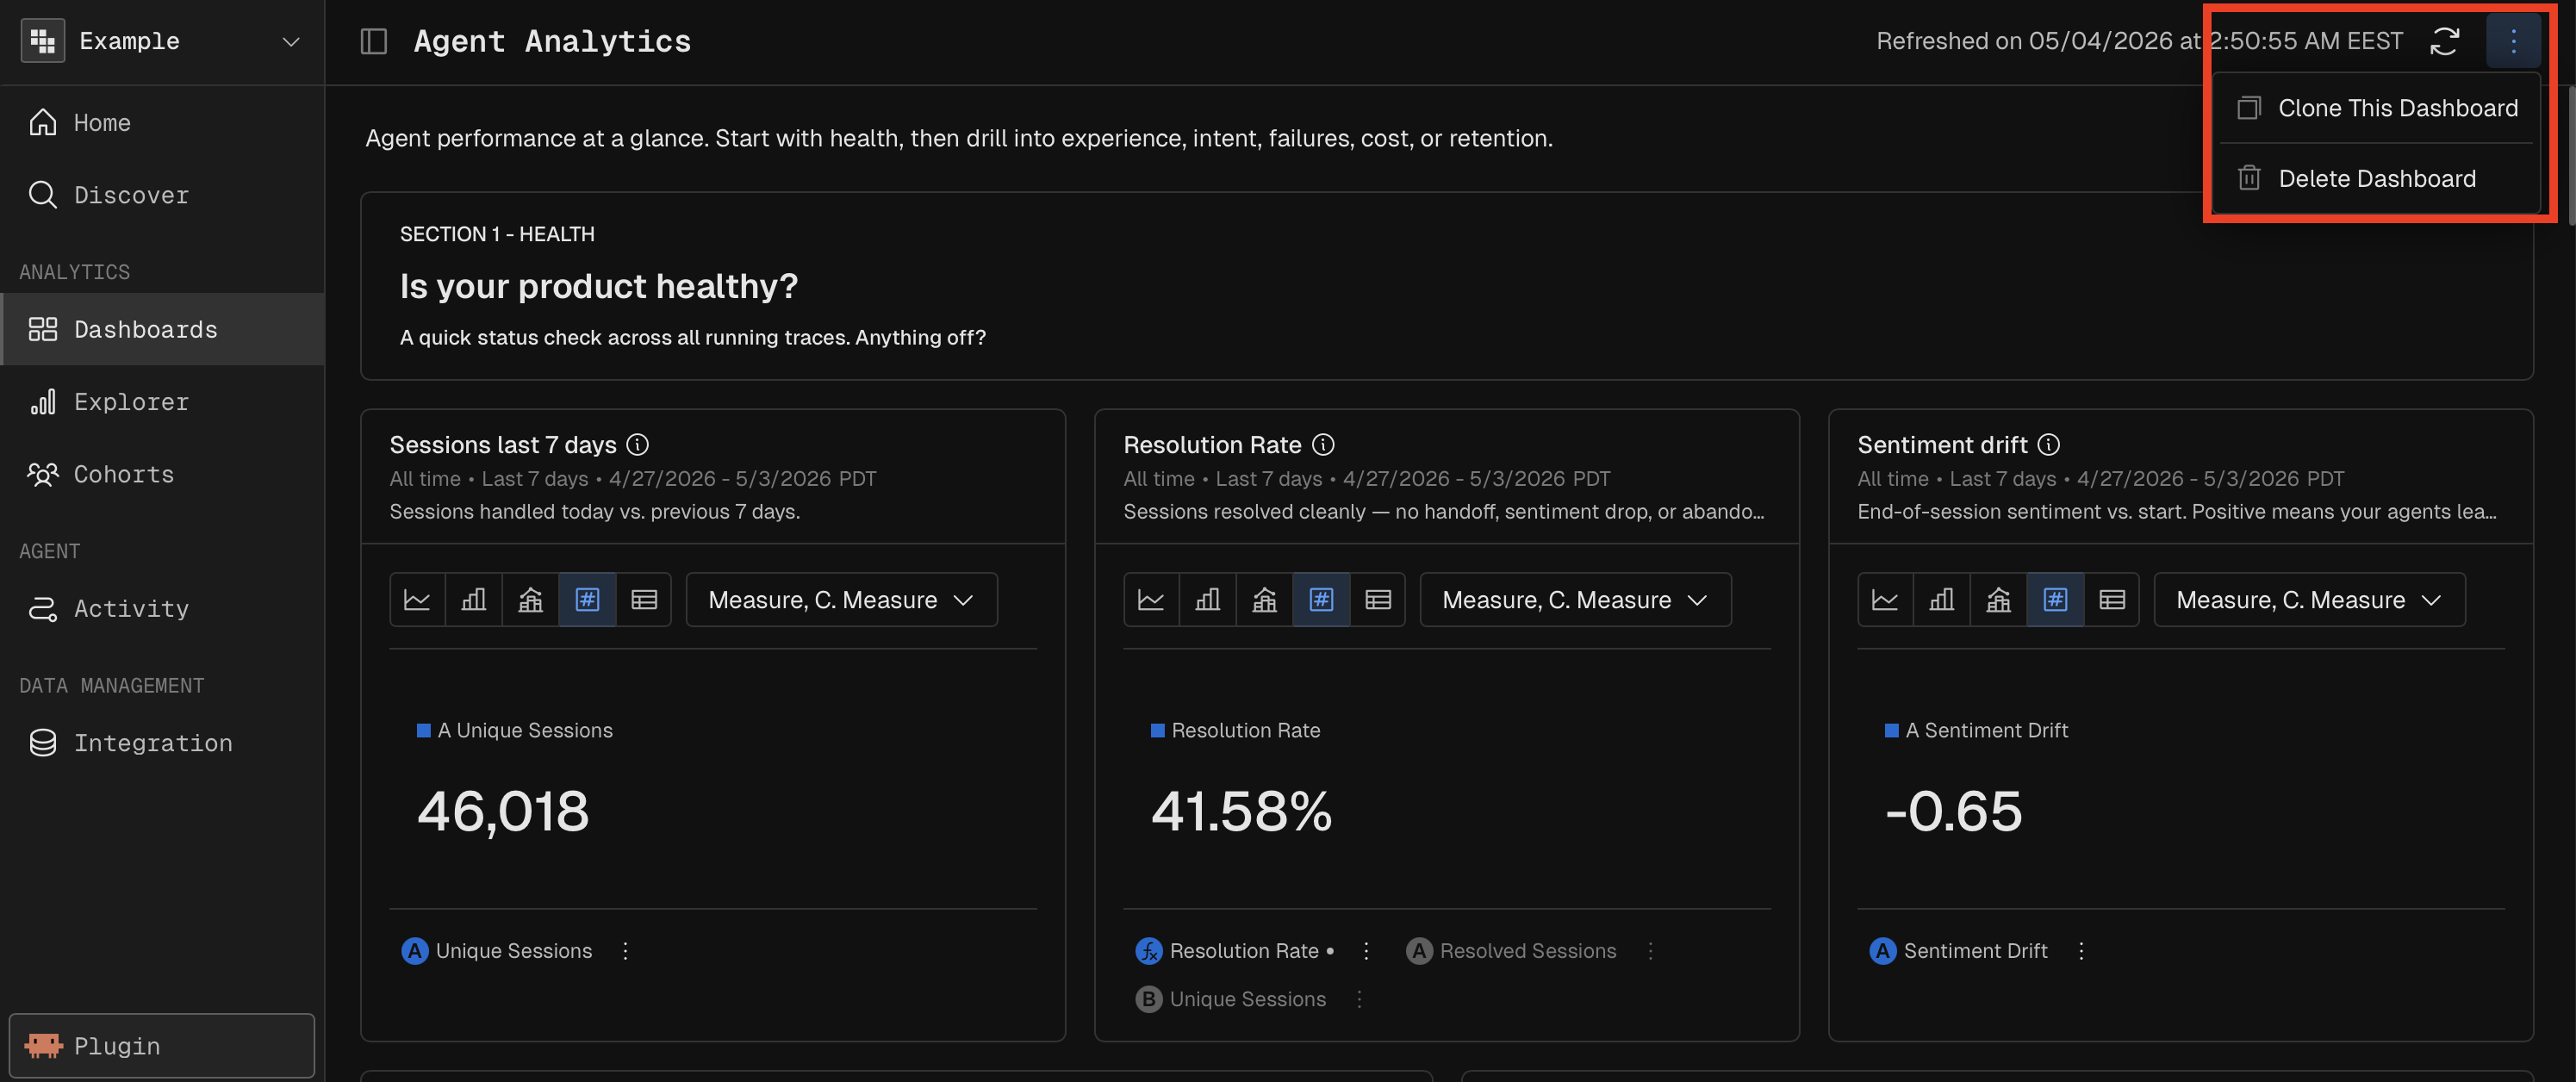
Clone
Duplicate an entire dashboard — layout, reports, and content — via Clone This Dashboard in the options menu. Enter a new name and description for the clone. You are navigated to the cloned dashboard automatically.
Delete
Delete a dashboard via the options menu. A confirmation modal warns that the action cannot be undone. If you delete the dashboard you're currently viewing, you're redirected to the dashboard list.