Formula
Formulas let you create calculated metrics by combining measures with arithmetic expressions. Instead of looking at raw Count or Sum values independently, you can compute ratios, differences, and other derived metrics directly in the report.
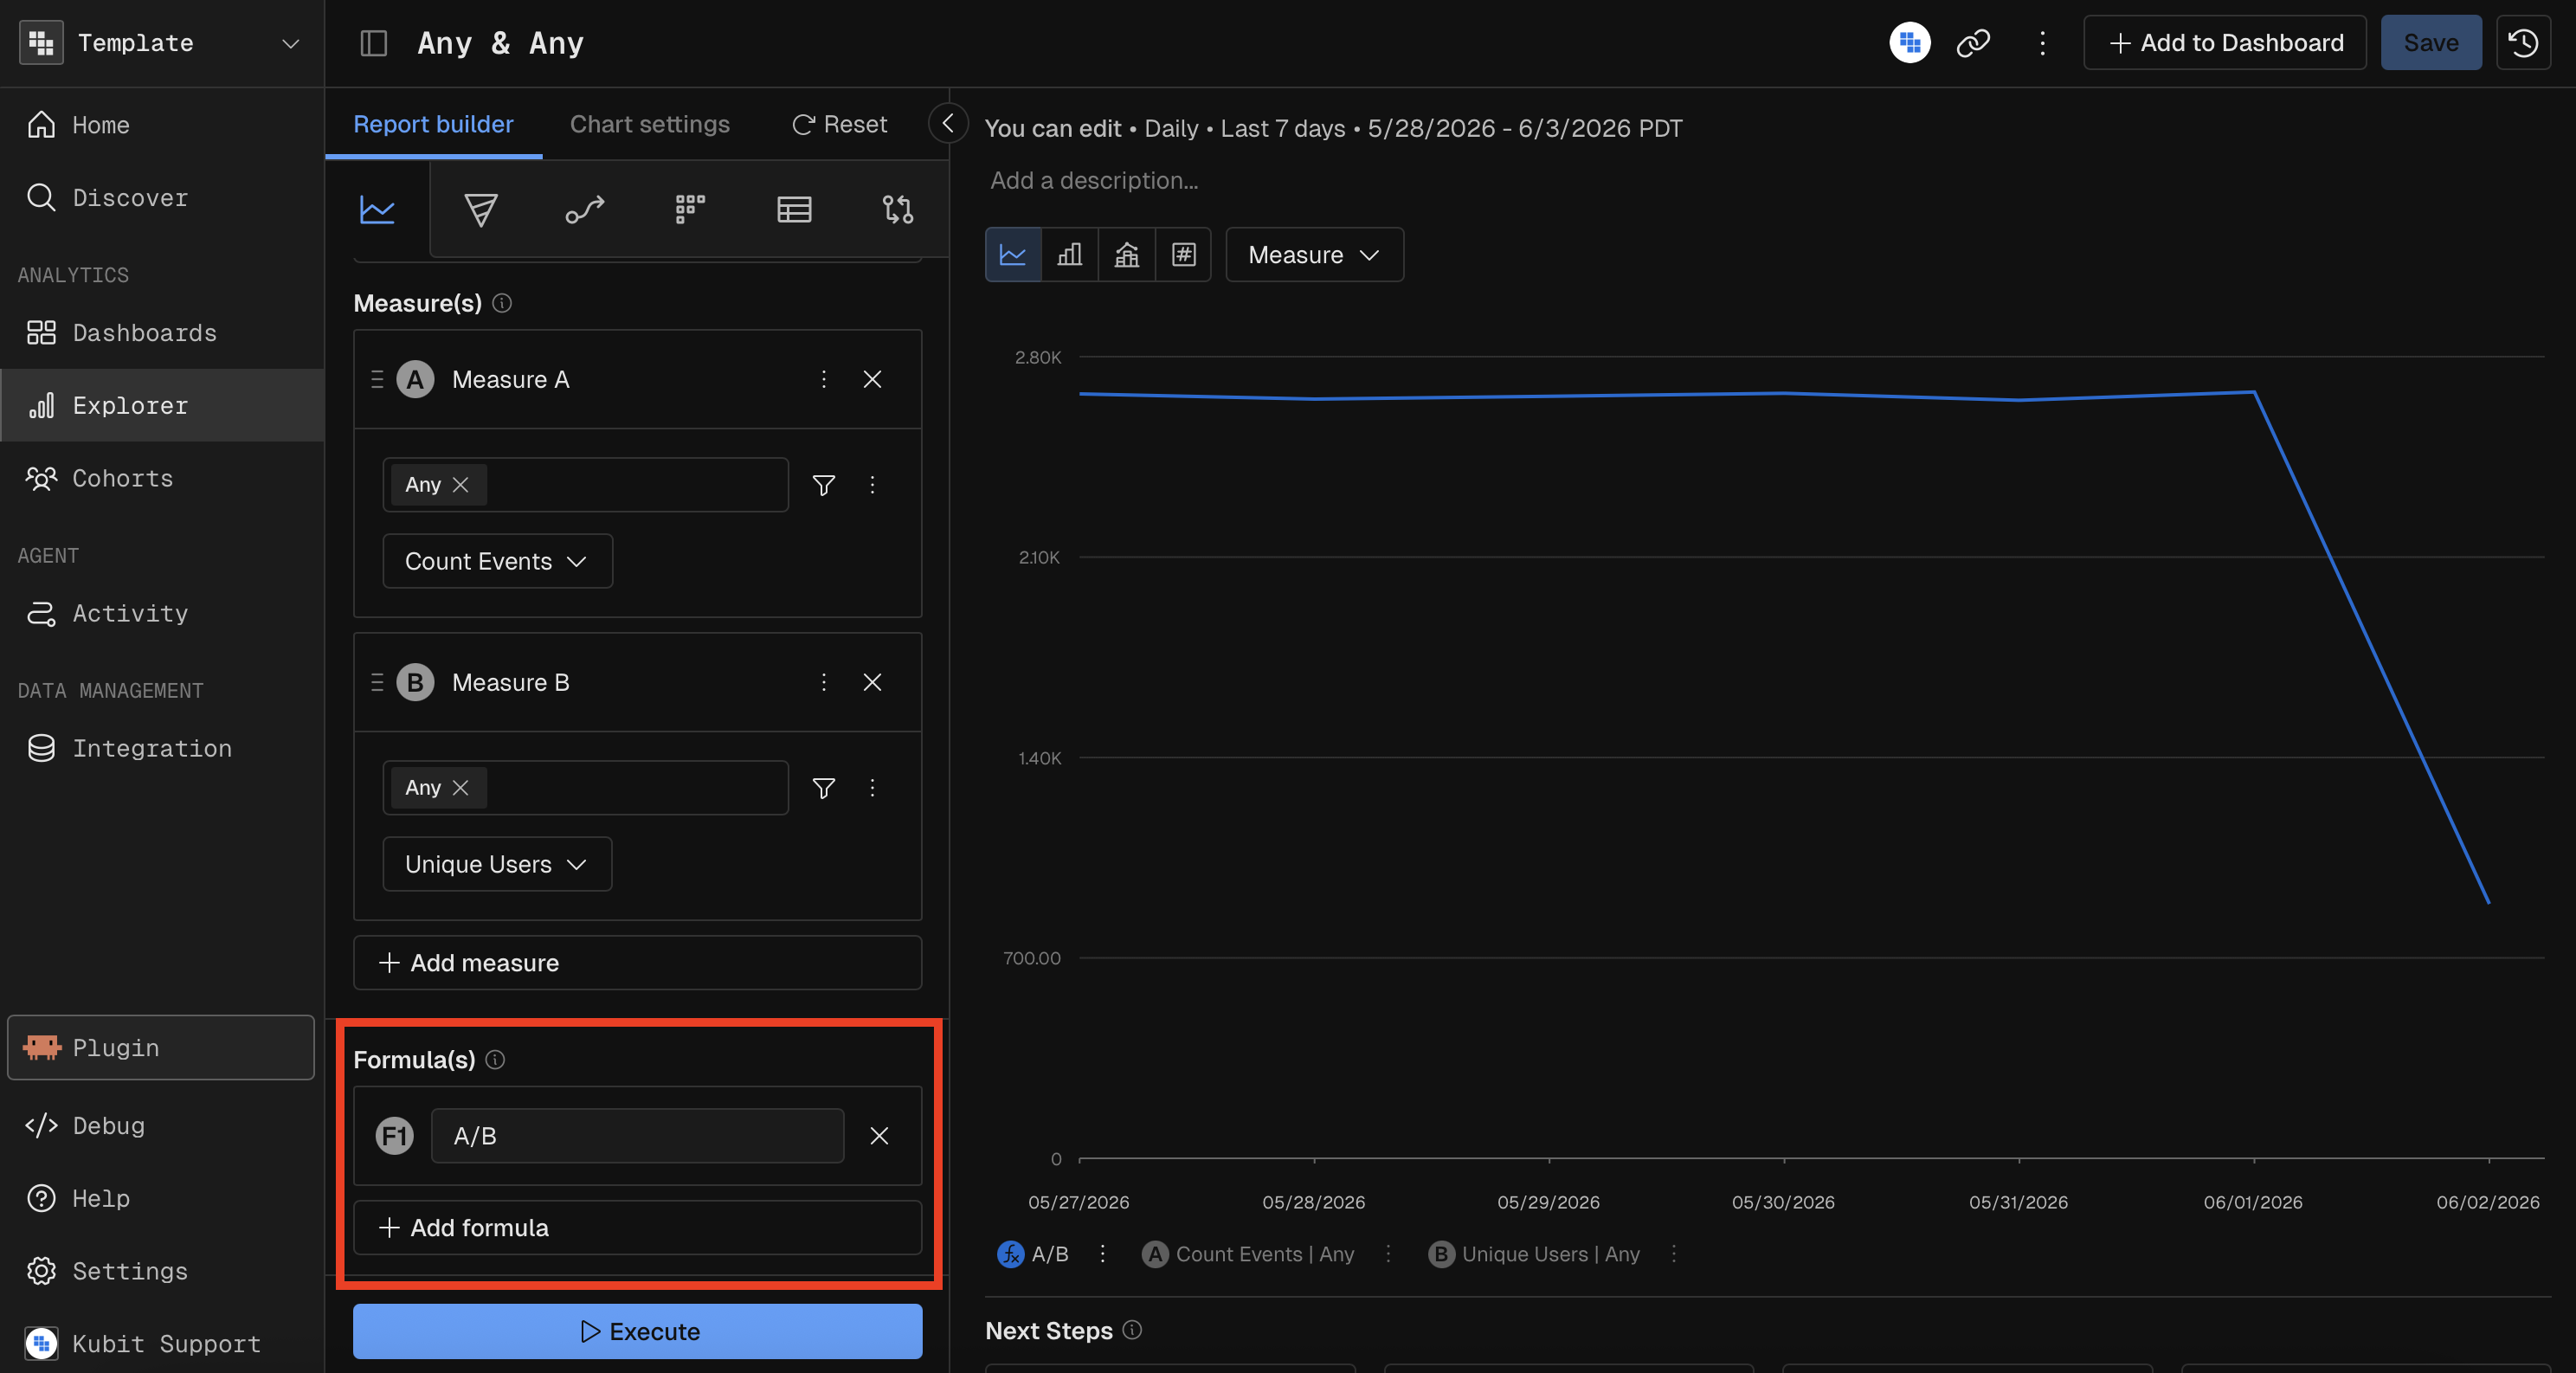
How It Works
Each measure you add to a report is assigned a letter variable — the first measure is A, the second is B, the third is C, and so on. A formula references these letters to define a calculation.
Example Formula | What It Computes |
|---|---|
| Ratio of measure A to measure B |
| Sum of A and B divided by C |
| Percentage of A relative to B |
| Difference between A and B |
Supported Operators
Operator | Description |
|---|---|
| Addition |
| Subtraction |
| Multiplication |
| Division |
| Parentheses for grouping |
Formulas are case-insensitive — typing a/b is equivalent to A/B.
Limits
Chart Type | Max Formulas |
|---|---|
Histogram | 1 |
Heatmap | 1 |
All others | 3 |
When Formulas Are Required
Some chart types require a formula when you have multiple measures (compound measures):
Histogram — must reduce multiple measures to a single computed value
Heatmap — must reduce multiple measures to a single computed value
Treemap — must reduce multiple measures to a single computed value
Waterfall — must reduce multiple measures to a single computed value
For chart types like Bar, Line, Combo, and KPI, formulas are always optional — each measure renders independently.
Side Effects of Division Formulas
When your formula includes a / operator:
The Overall toggle in Group By is automatically enabled (needed for ratio calculations across groups).
Pie chart percentage view is disabled (division-based ratios can't be meaningfully converted to percentage-of-total).
Validation
Formulas are validated in real time as you type. If the expression is invalid (e.g., unbalanced parentheses, referencing a measure letter that doesn't exist), an error message appears and the report won't execute until the formula is corrected.
Restriction: Formulas can only reference measure variables (A, B, C…). They cannot reference other formulas.
MCP Prompt Examples
"Show me the ratio of successful events to total events per day over the last 14 days"
"Create a line chart of (sum revenue minus sum refunds) divided by count distinct users, weekly, last 3 months"