Behavior Analytics
Traditional product analytics tools force you to export, transform, and ingest event logs into their proprietary black boxes before you can run a single query. Kubit flips this model. Our Behavior Analytics engine runs directly on top of your existing cloud data warehouse (Snowflake, BigQuery, Databricks) using a zero-copy, push-down query architecture.
This document explains how Kubit translates behavioral analytics concepts into optimized, warehouse-native SQL, allowing you to build complex funnels, track retention, and map user paths without writing manual JOINs or maintaining brittle ETL pipelines.
How the Query Engine Works
When a user interacts with Kubit's UI, or when an AI agent requests data via the Model Context Protocol (MCP), Kubit does not query a replicated database. Instead, it acts as a semantic compilation layer.
Semantic Translation: Kubit takes the defined behavioral parameters (e.g., "Show me the 7-day retention of users who triggered
agent_invokedfollowed bypurchase_completed") and maps them against your predefined semantic layer in the data modeler.Dialect-Specific SQL Generation: The engine compiles the request into highly optimized, warehouse-specific SQL. It leverages advanced database features like Snowflake's
MATCH_RECOGNIZEor BigQuery's specialized window functions to handle complex temporal joins efficiently.Push-Down Execution: The query executes entirely within your warehouse's compute cluster.
Result Rendering: Only the aggregated result set is returned to Kubit for visualization or API delivery. Your raw event-level data, traces, and PII never leave your infrastructure.
Core Behavior Analytics Reports
Kubit abstracts the complexity of behavioral SQL into four primary query types. Each is designed to handle non-deterministic agent interactions right alongside traditional deterministic clickstream data.
Query
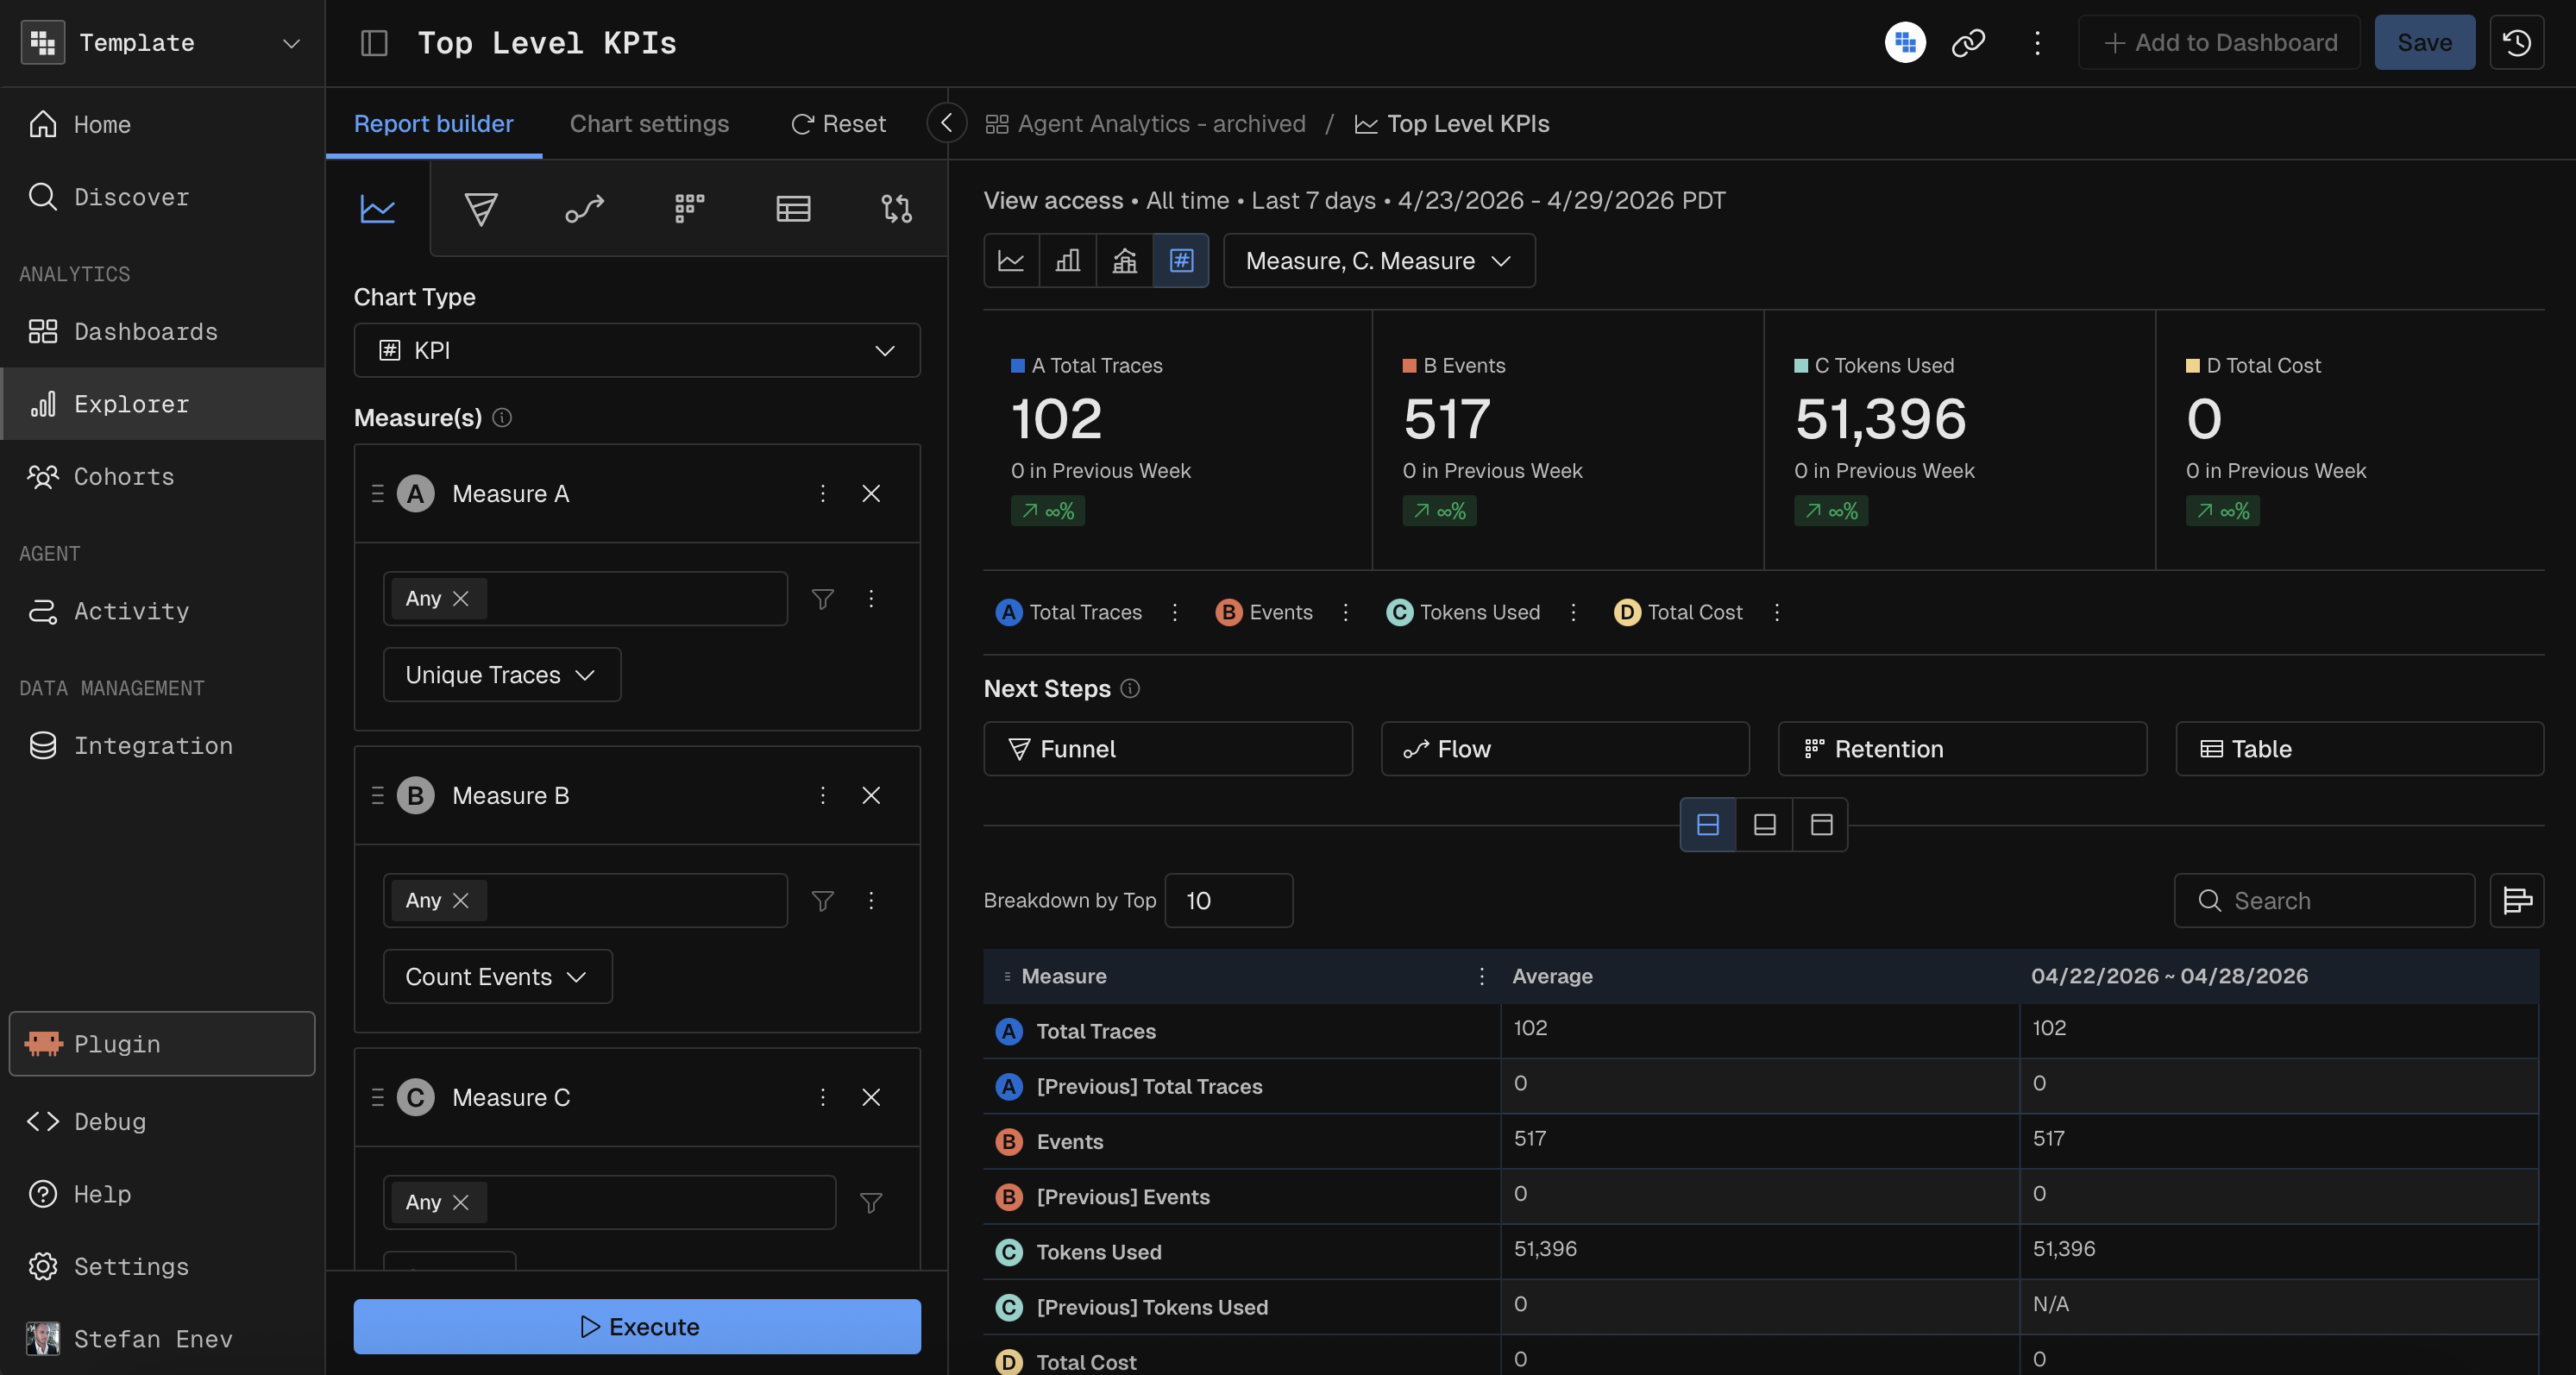
The Query report is your foundational engine for time-series analysis, custom aggregations, and multidimensional segmentation. It allows you to calculate absolute event counts, distinct user metrics, or statistical distributions of any specific property over time.
How it executes: Kubit compiles these requests into highly optimized
GROUP BYstatements. It leverages warehouse-native aggregate functions (likeCOUNT(DISTINCT),SUM,AVG, andPERCENTILE_CONT) mapped across dynamic time windows, ensuring rapid execution even when querying billions of raw log rows.Developer Use Cases:
Performance Monitoring: Tracking the P95 latency of specific agent tool calls, grouped by model version to detect performance regressions.
Cost Tracking: Aggregating daily token consumption (e.g.,
SUM(completion_tokens)) broken down byintent_typeto identify exactly which automated workflows are driving infrastructure costs.Anomaly Detection: Visualizing spikes in
LLM_ExceptionorTimeoutevents over time to quickly detect third-party API rate limits, schema mismatches, or prompt parsing failures.
There are many more advanced features in Query like Compare, Impact Analysis, Binning, along with visualization in scatterplot, heat map and data table.
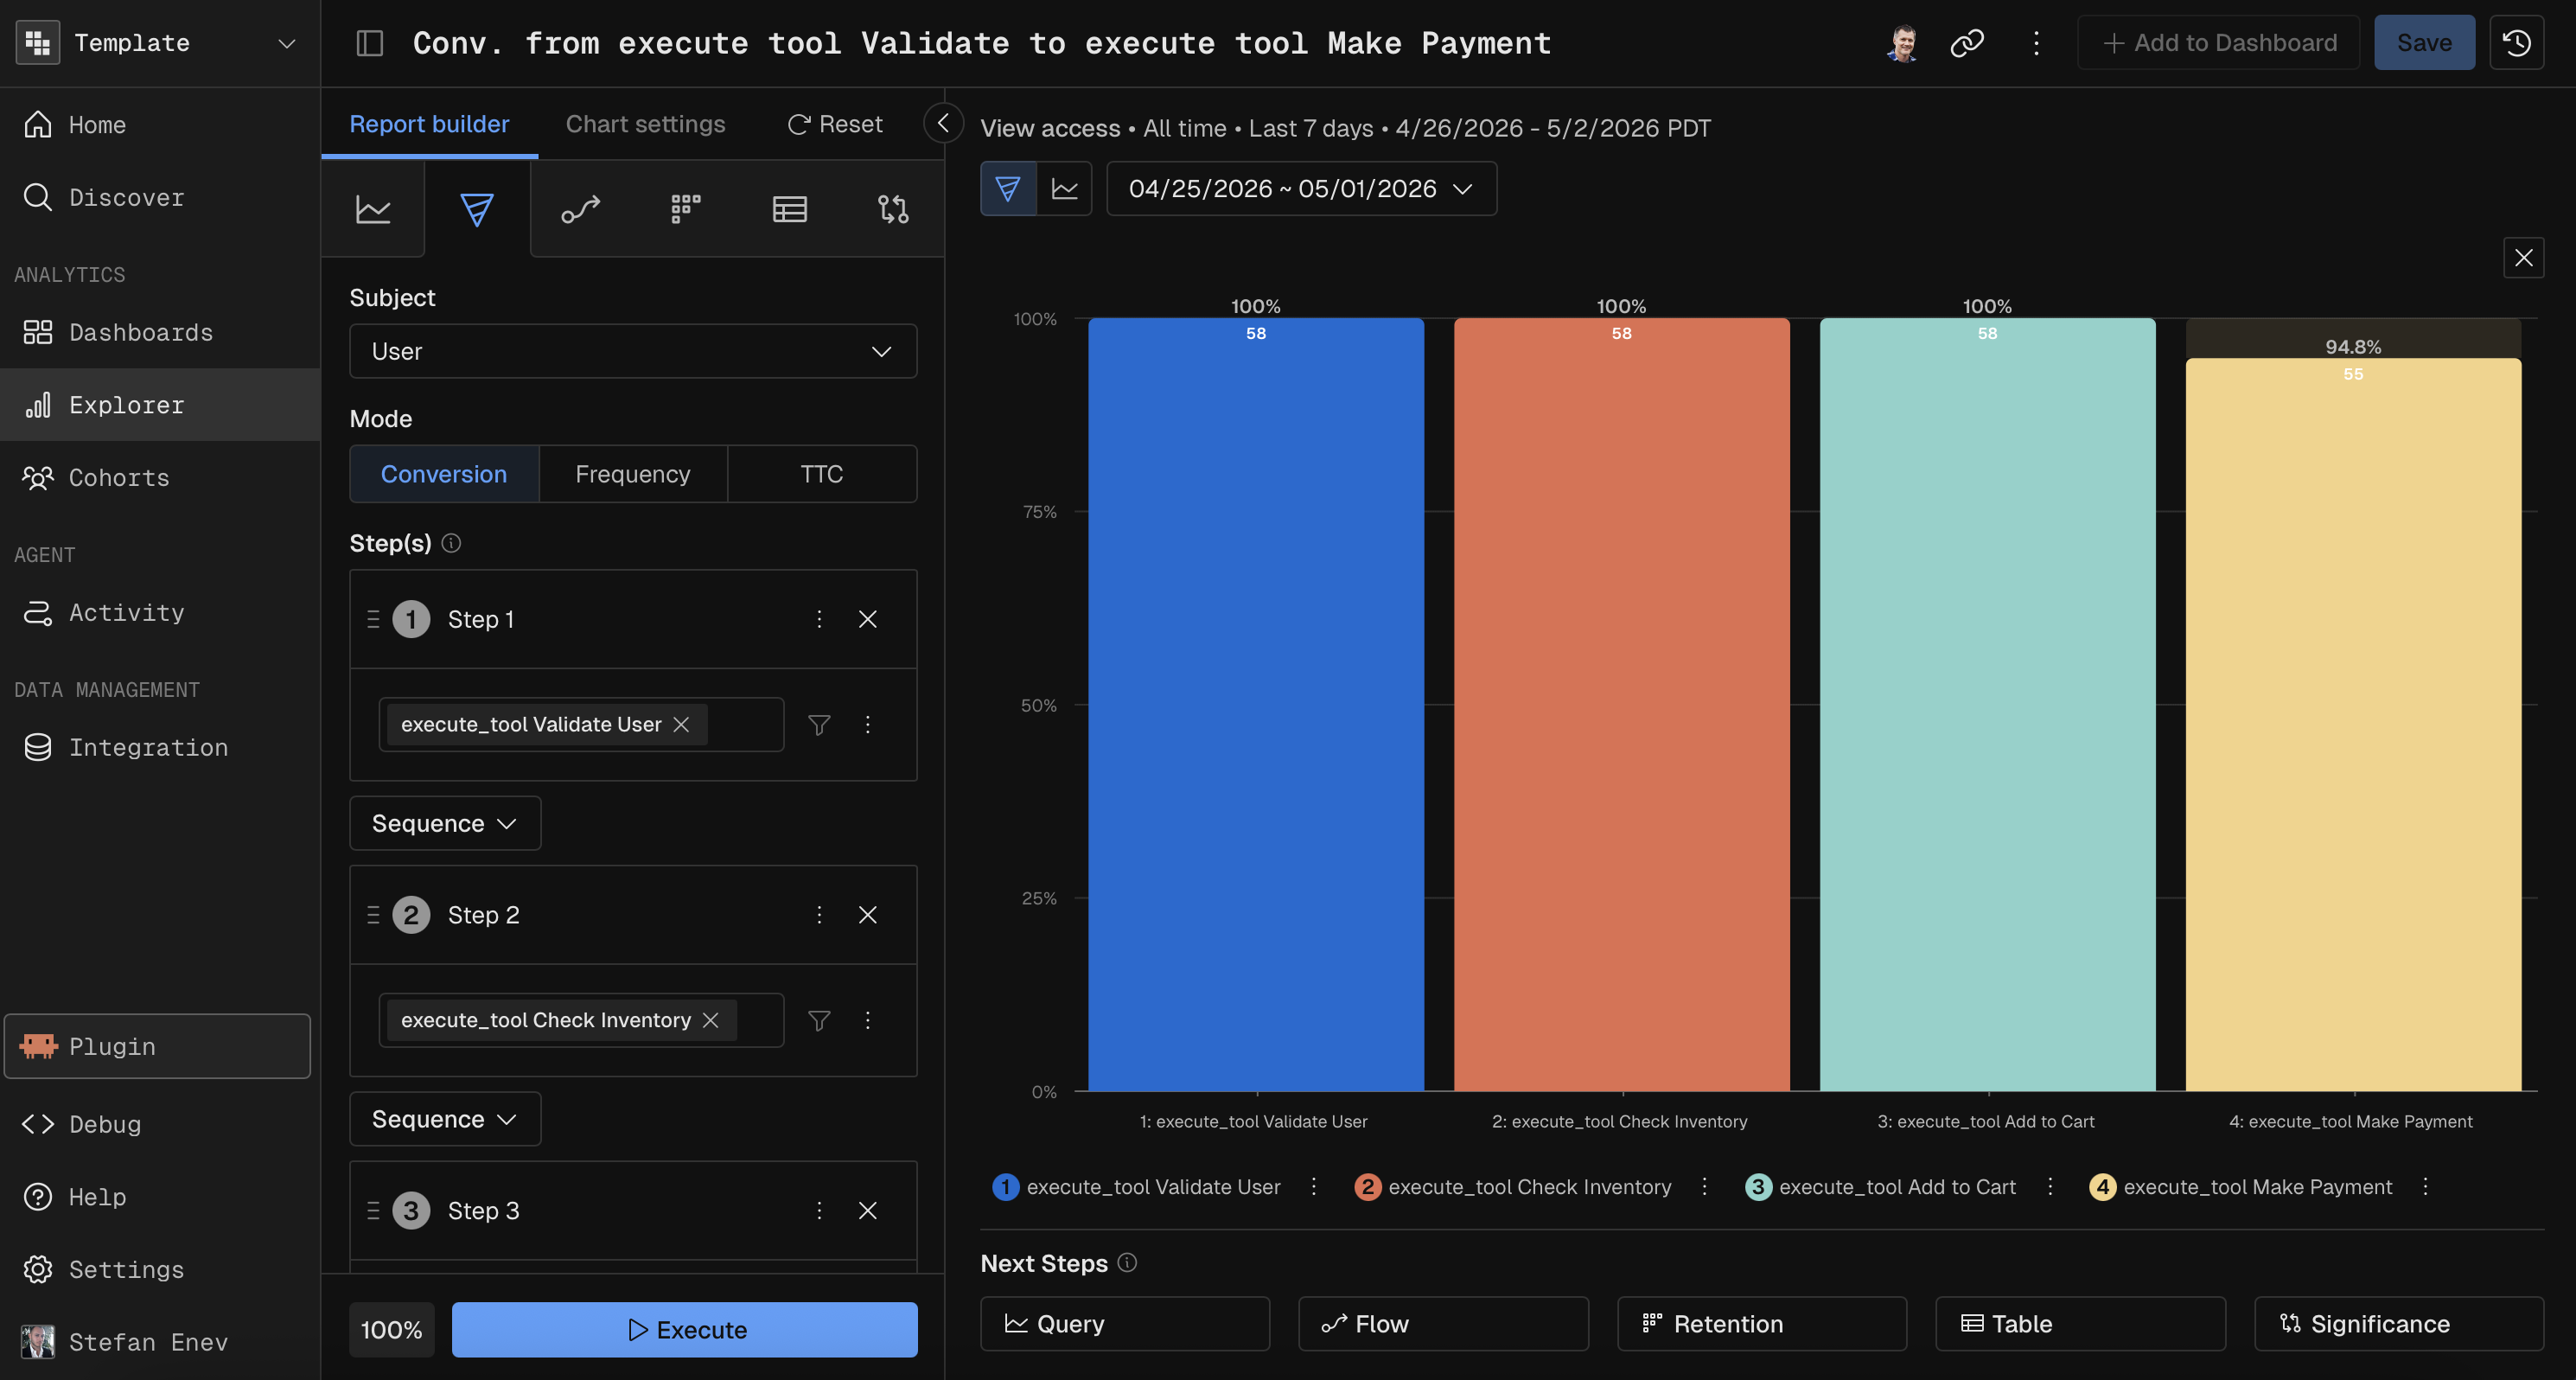
Funnel
Funnel measures conversion rates and drop-offs across a defined chronological sequence of events.
How it executes: Kubit utilizes complex windowing functions and sequence-matching algorithms native to your warehouse to calculate exact event paths, respecting strict session boundaries and time-to-convert constraints.
Developer Use Case: Identifying exactly where an agent's multi-step tool execution breaks down, or pinpointing the exact UI step where users abandon a flow after an LLM hallucination.
Retention
Retention tracks how often users return to perform a specific action after an initial baseline event.
How it executes: The query engine groups users into temporal cohorts (daily, weekly, monthly) and calculates the rolling or strict time-bounded intersection of the baseline event and the returning event.
Developer Use Case: Measuring the long-term impact of a new prompt deployment or model upgrade. Do users who interact with the new model return to the app at higher rates in the following 30 days?
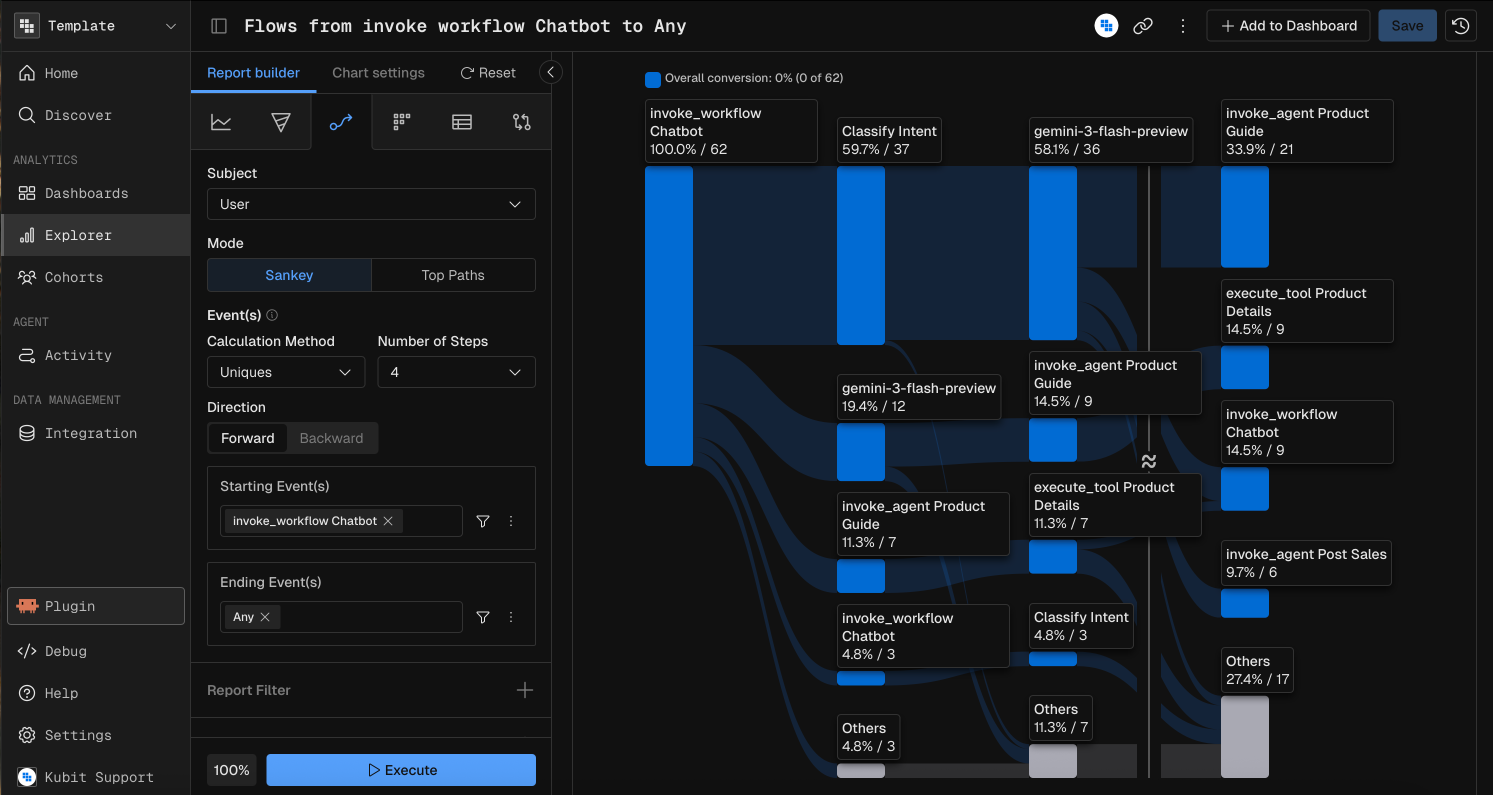
Flow / Path
Flow visualizes the organic, multi-directional flow of events leading up to, or originating from, a specific action.
How it executes: Kubit recursively queries user sessions to map the most frequent N events before or after the anchor event, aggregating the varying branches into a structured tree payload.
Developer Use Case: Discovering the "unhappy paths." For example, mapping the exact sequence of rage clicks, repeated prompt submissions, and UI reloads that occur immediately before a user triggers a negative sentiment flag.
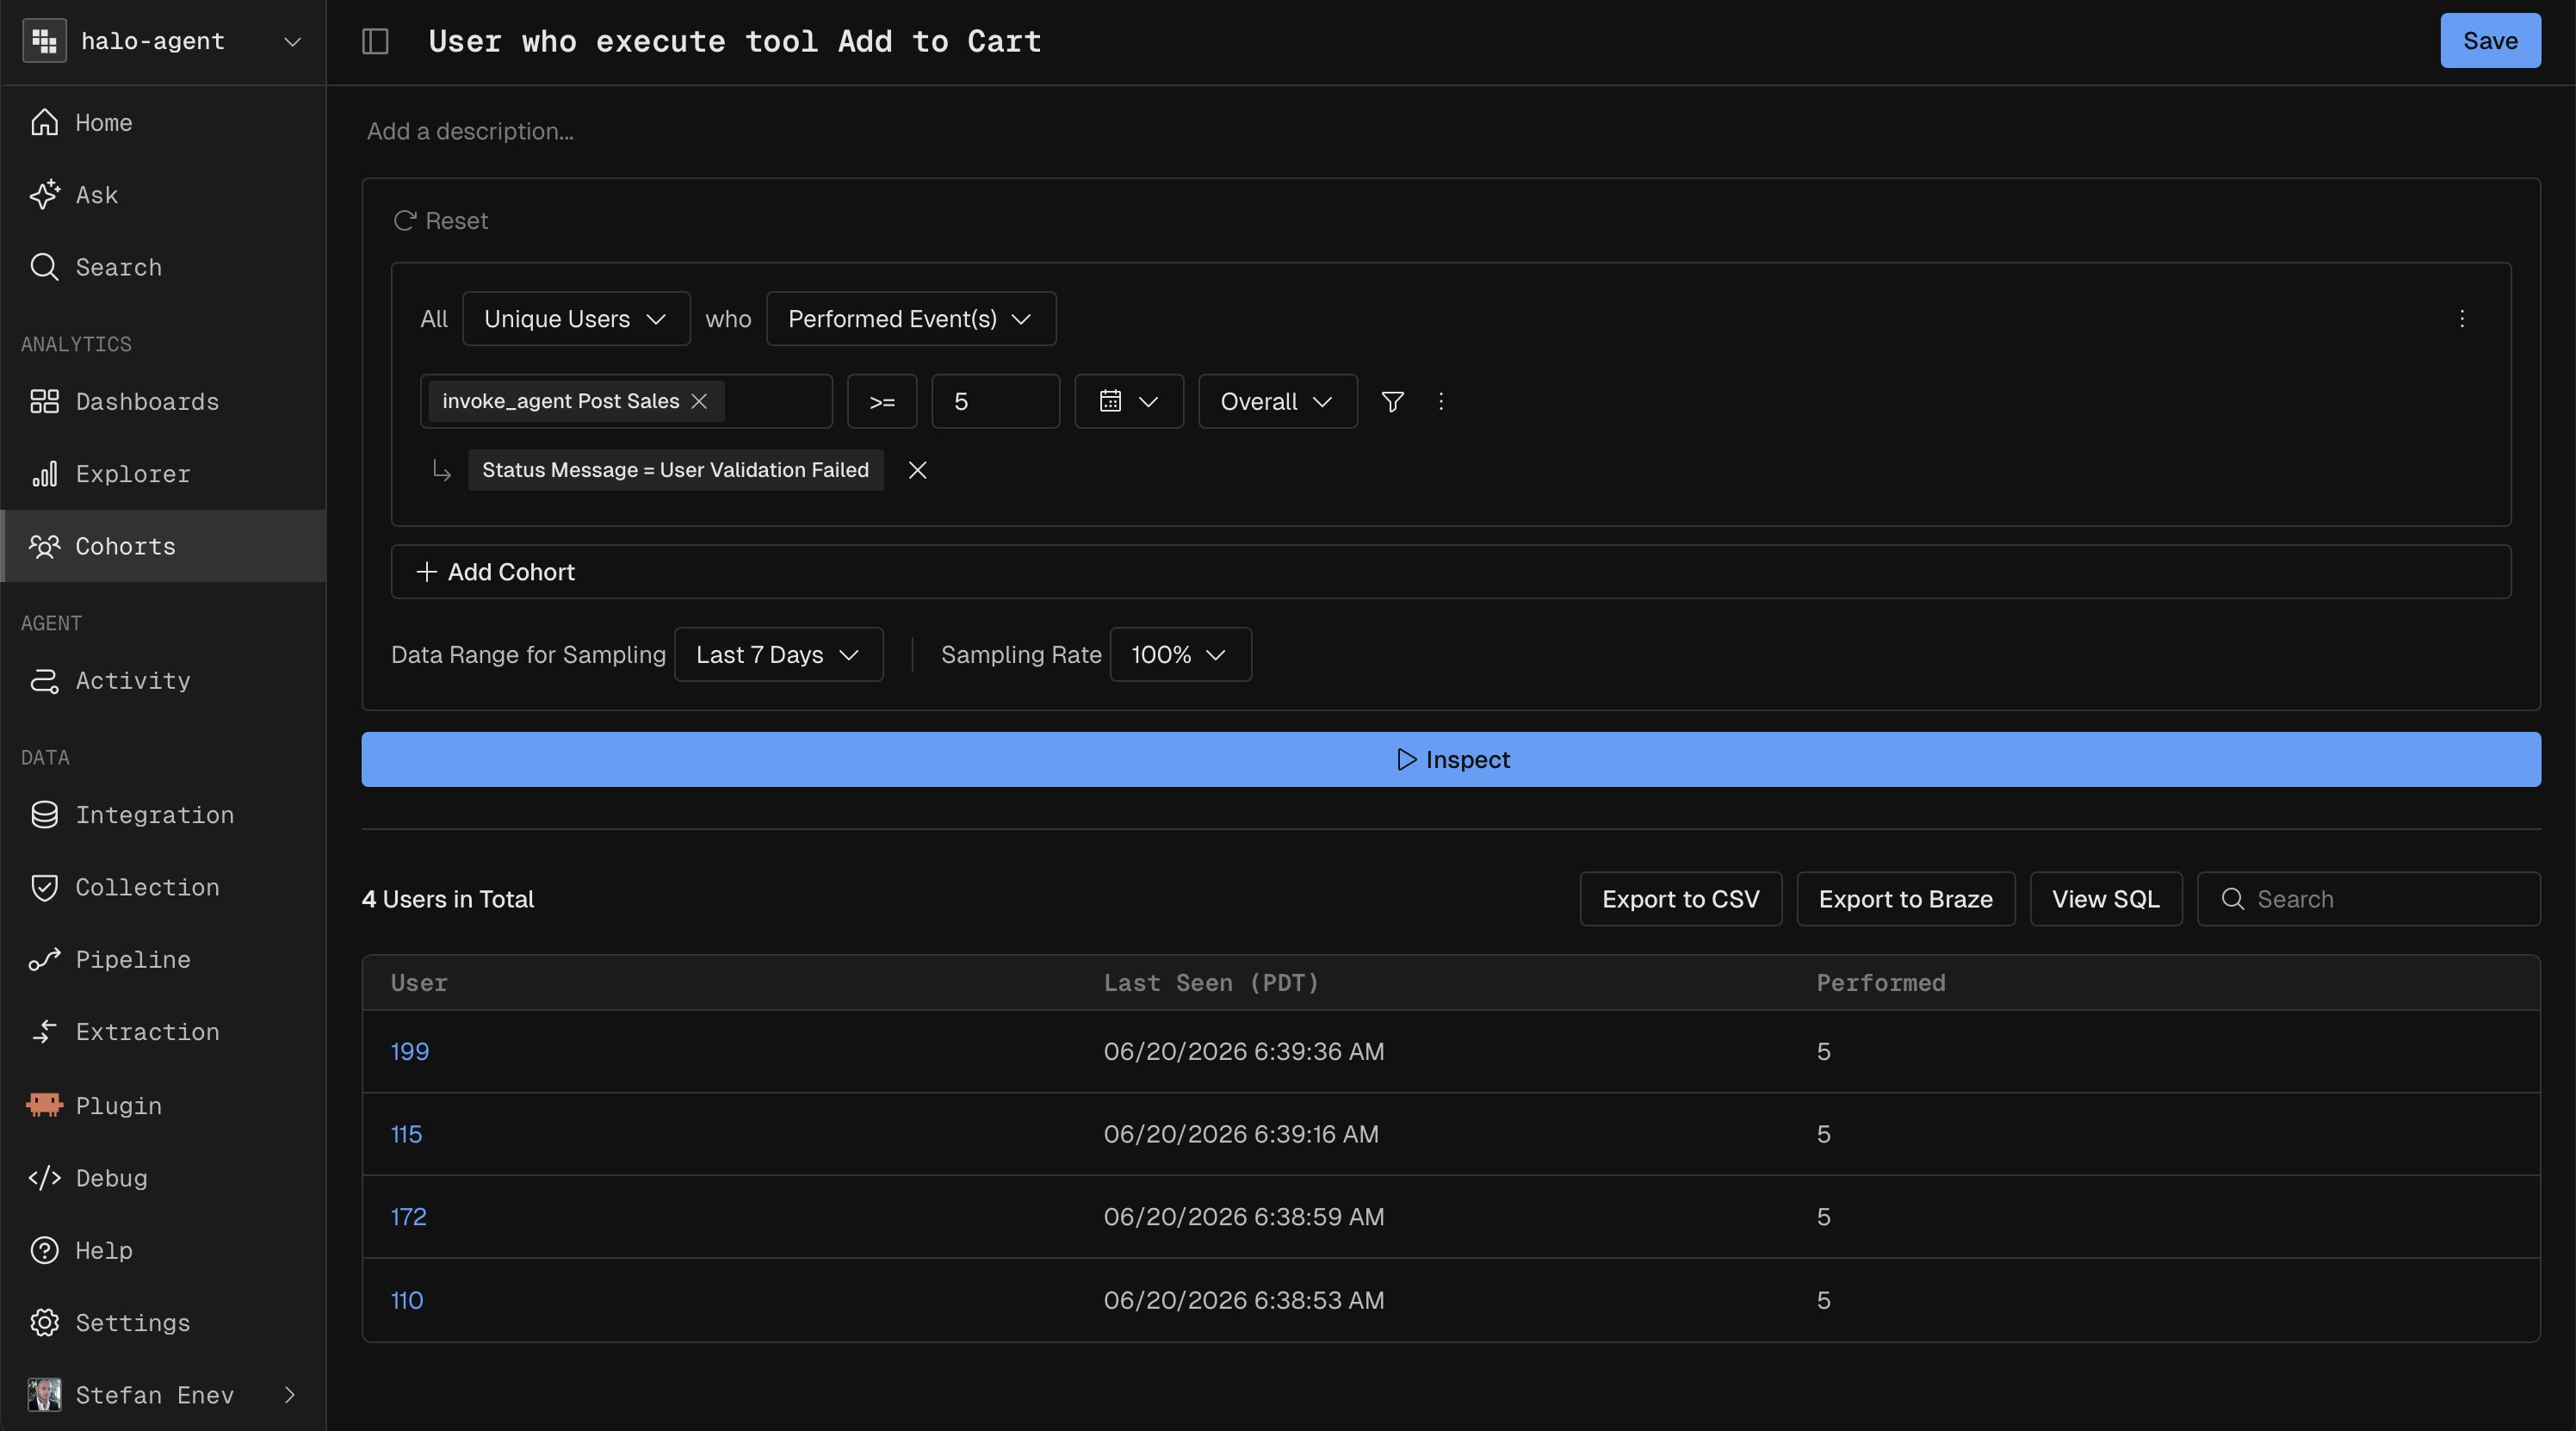
Cohort
Cohorts are dynamic segments of users defined by their specific behaviors, attributes, or trace histories.
How it executes: Kubit compiles complex boolean logic into optimized
WHEREandHAVINGclauses, generating a materialized view or temporary table of user IDs that can be cached and applied as a global filter against any other query type.Developer Use Case: Creating a cohort of users who experienced an
agent_timeouterror more than three times in a week, and passing that cohort back to your auto-remediation workflows or alerting systems.
Advanced Use Cases
Braze Integration: utilize Kubit to define and analyze user cohorts dynamically, then use Braze to target them directly to improve your user engagement.
Significance report: mostly used for analyzing AB test results to determine whether an observed difference between two groups is statistically real or just random noise.
Data Table: explore raw aggregated data in tabular form with more dimensional depth than a chart-based Query report allows.
Nested Fields: expose internal properties buried inside dynamic data like JSON or BigQuery Struct types (such as user_properties and event_params for Firebase data) for use in Filter, Breakdown, or Function.
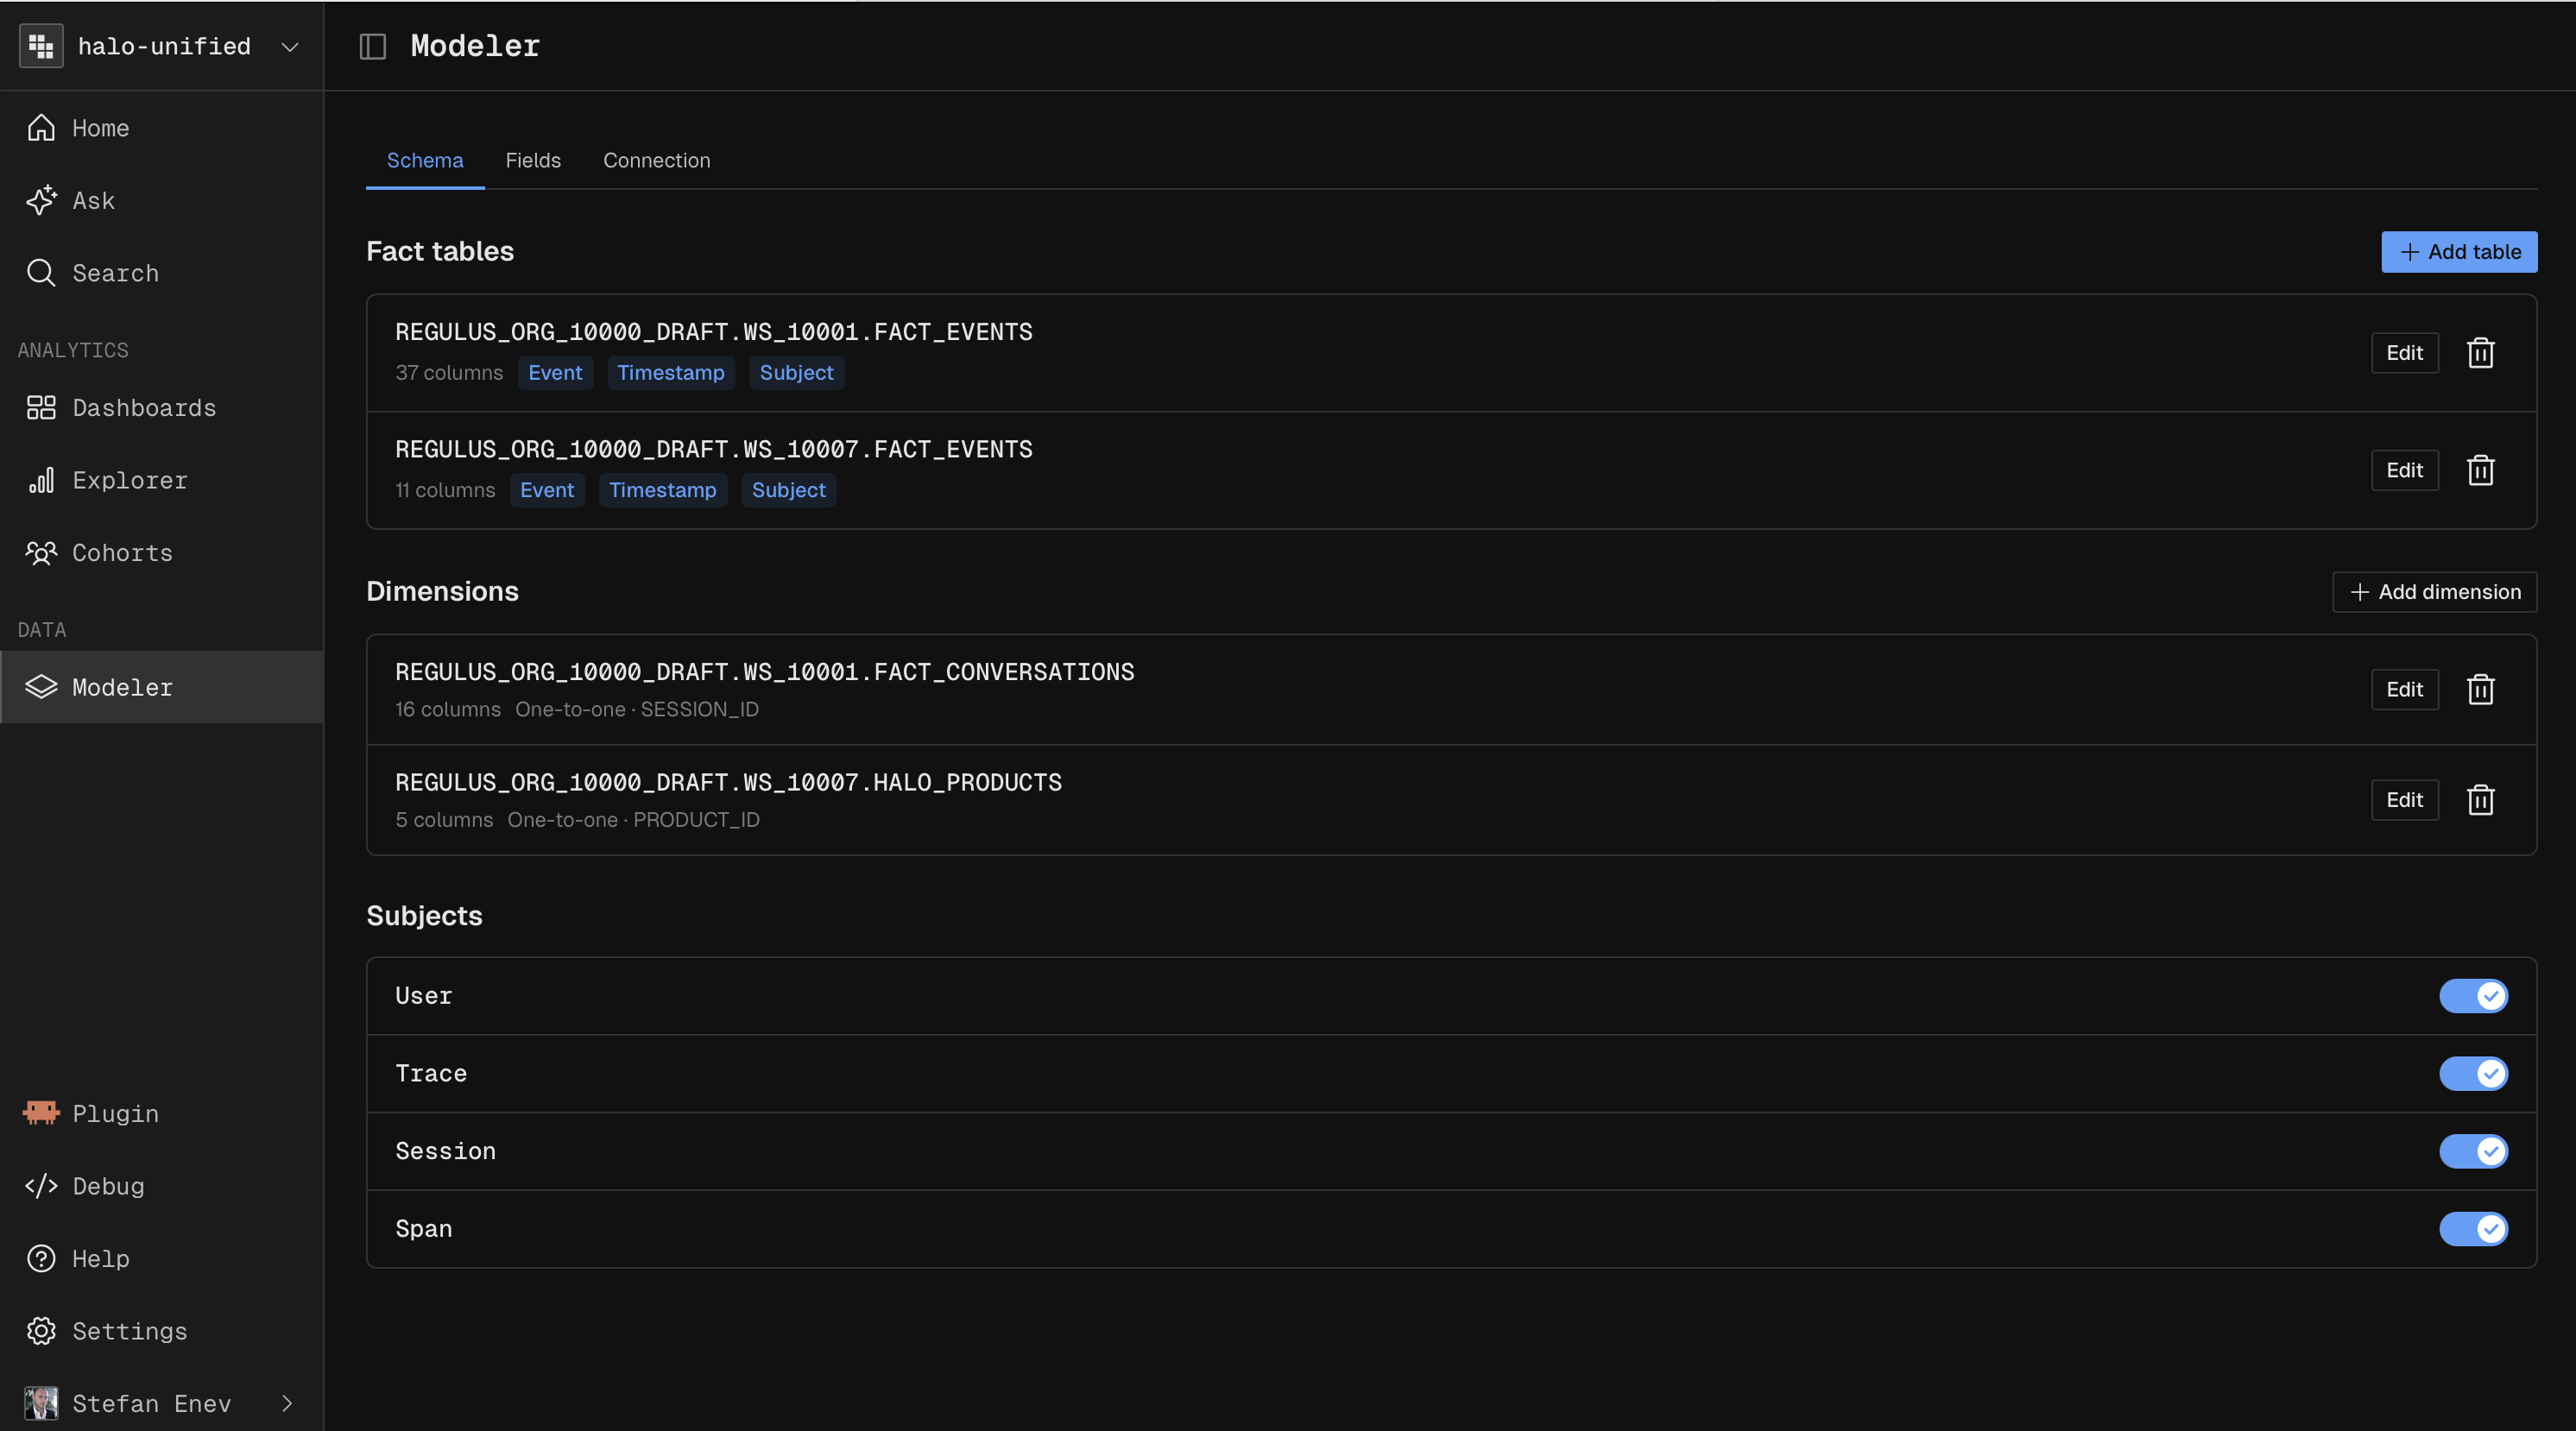
Complex Data Modeling
Because standard product analytics tools require you to ingest data into their proprietary storage, joining your event streams with external business data usually requires building brittle ETL pipelines to flatten your data before sending it.
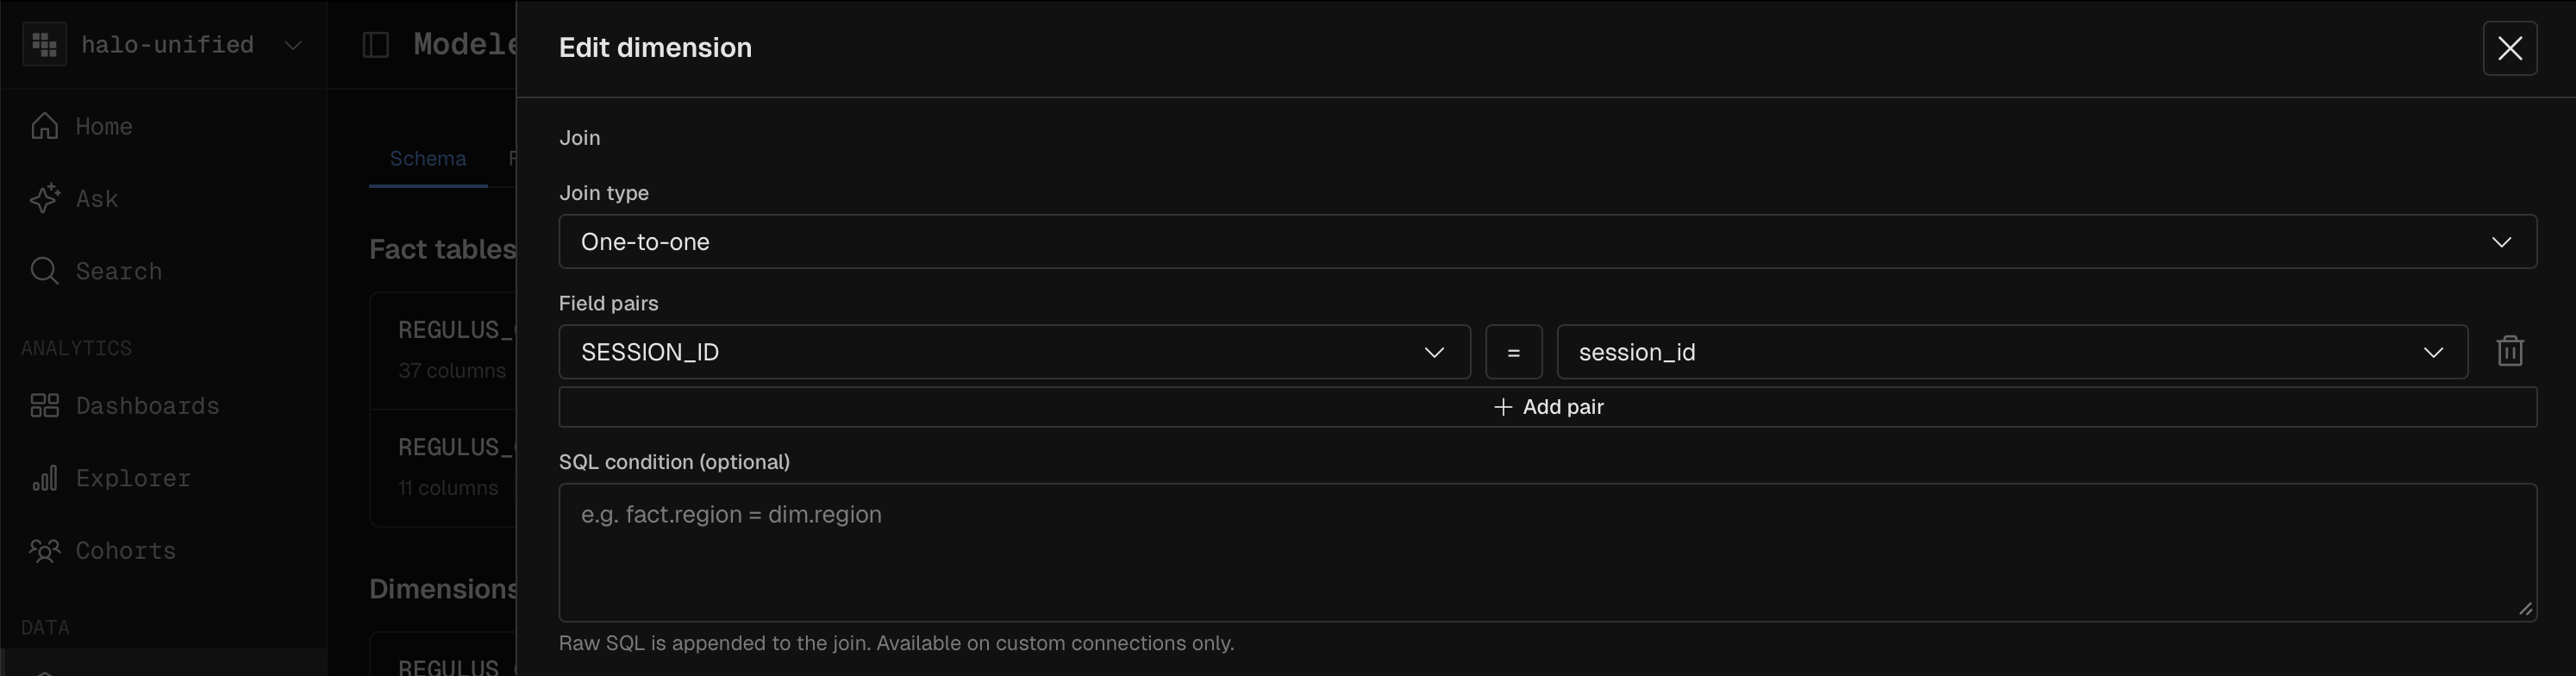
Kubit’s warehouse-native architecture eliminates this entirely. Through the self-service semantic layer, you can define relationships between your time-series event tables (user clicks, agent traces) and your existing dimensional tables directly in your cloud data warehouse. This unlocks deep relational analysis without duplicating data.
A/B Test & Feature Flag Integration
Evaluating a new LLM feature often requires cross-referencing telemetry with experiment allocation data from platforms like LaunchDarkly or Optimizely, which already live in your warehouse.
The Model: Map an
experiment_exposuredimension table directly to your agent activity events.The Workflow: Run a Funnel or Query comparing the exact
resolution_rateorp90_latencyof an agent workflow between "Control" and "Variant A."The Outcome: You can definitively measure the business impact of an underlying prompt or model change against your core product metrics, without writing complex custom SQL or manually exporting trace logs into a spreadsheet.
Marketing Campaign and CRM Attribution
AI engineers need to know if the expensive agentic workflows they build are actually serving high-value users or if they are being saturated by low-intent traffic from a specific marketing channel.
The Model: Join your standard behavioral events with your
marketing_campaignsdimension table or CRM data (e.g., Salesforce/HubSpot account tiers).The Workflow: Create a Cohort of users who originated from a specific "Q3 Enterprise Campaign" and analyze their
user_intentdistribution using the Query engine.The Outcome: Determine if specific marketing channels are driving users with intents that your agent is ill-equipped to handle, allowing product and marketing teams to align on targeting and agent capabilities.
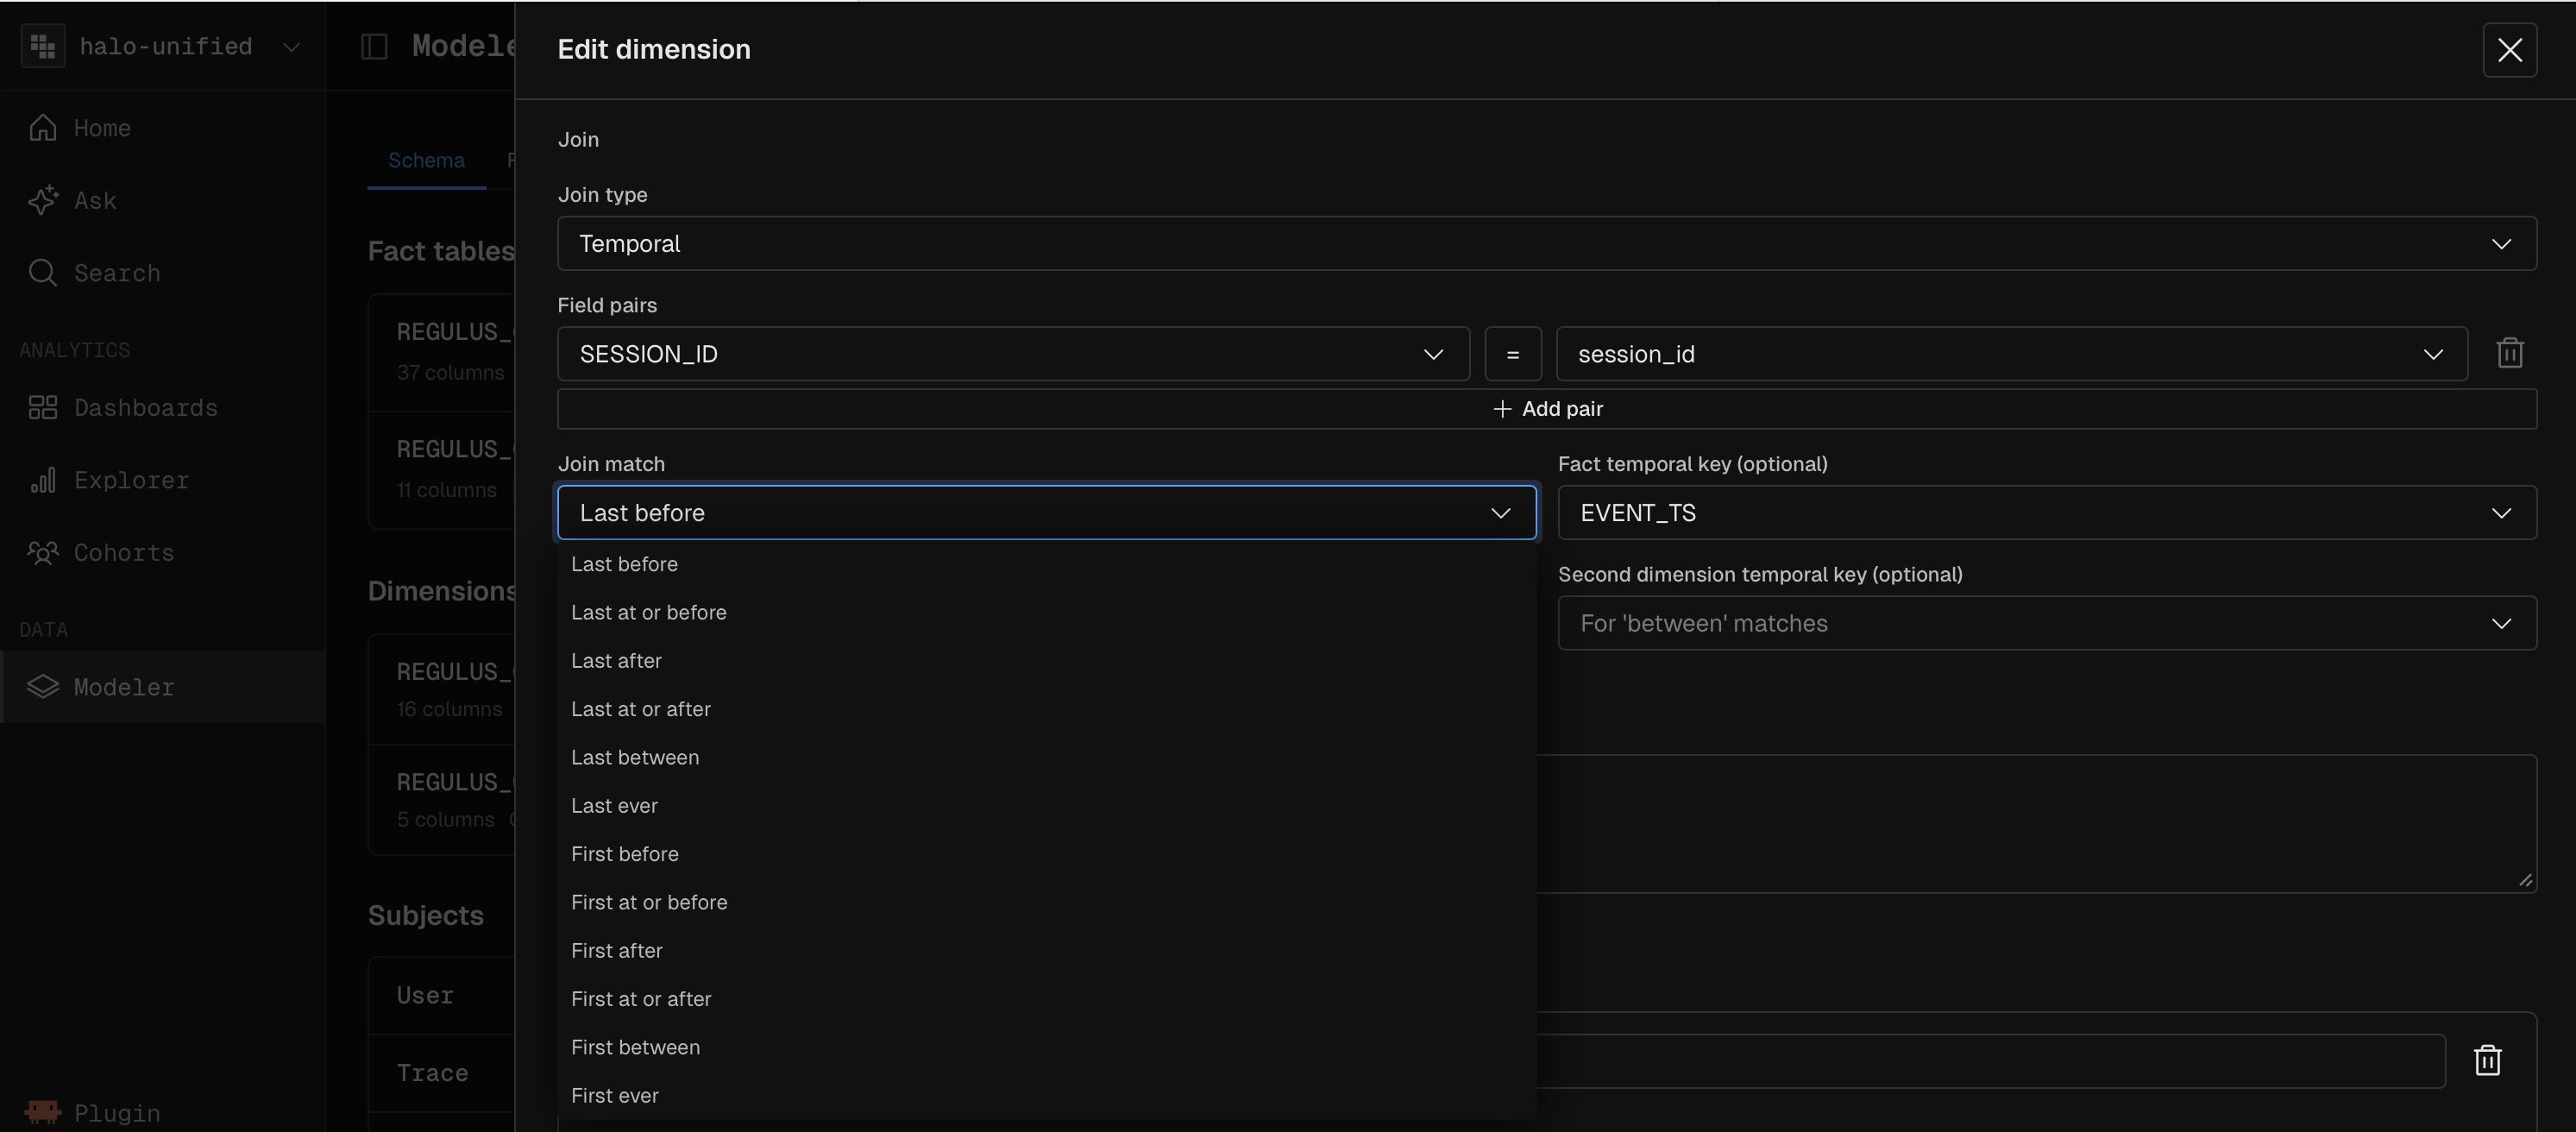
Temporal Joins for Slowly Changing Dimensions (SCD)
User states change over time. If you join an event to a user's current status, you introduce historical inaccuracies. Kubit’s engine natively handles temporal (point-in-time) joins directly in your data warehouse.
The Model: Link your event stream to a slowly changing dimension table (e.g.,
user_subscription_historywithvalid_fromandvalid_totimestamps).The Workflow: When analyzing an
agent_execution_failedevent from three weeks ago, the query engine automatically joins against the dimension table using the exact timestamp of the event.The Outcome: You can accurately determine that the agent failed because the user was on the "Free" tier at the exact moment of the trace, even if they upgraded to "Premium" yesterday. This guarantees pristine historical accuracy for debugging and behavioral analysis.