Agent Activity
Explore traces, events, sessions, and users in a single interactive grid — filter, search, and drill down to the exact trace, user, or session you need to debug.
What the LLM Activity Grid is
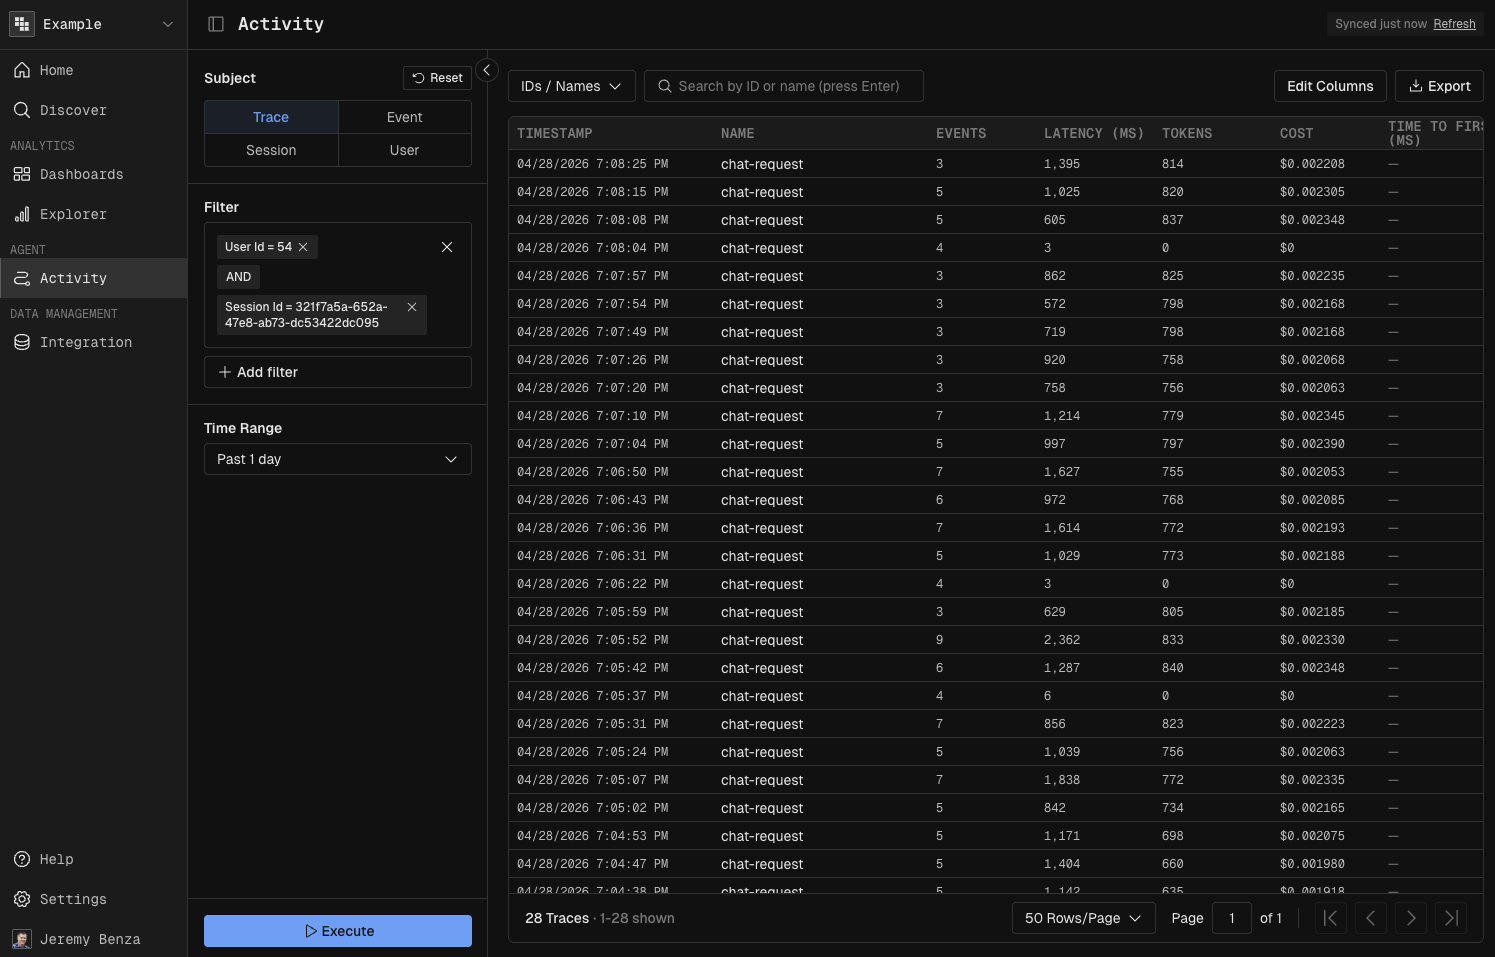
One view for everything your agents are doing in production. Traces, events, sessions, and users are all first-class tabs of the same grid, so you can start with a broad question ("show me the last day of traces") and end on a single trace's input, output, latency, and cost without leaving the page.
Open the LLM Activity Grid
In the left navigation, click LLM Activity.
Switch between the Traces, Events, Sessions, and Users view depending on what you want to look at.
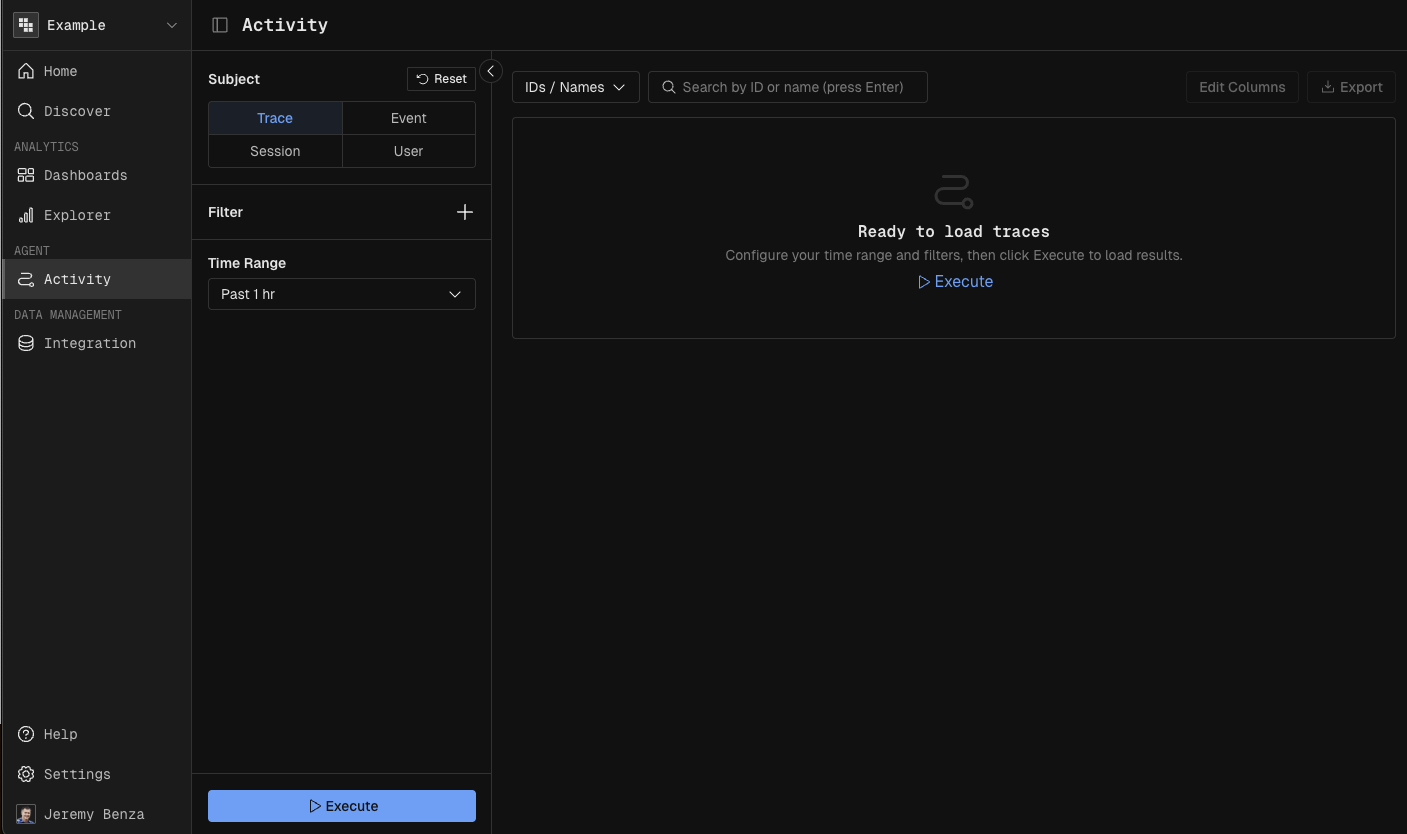
Filter and execute a query
Open the filter panel.
Set the time range to Last 1 day (or any window that matches your investigation).
Add any additional filters — trace name, user, intent, cost threshold.
Click Execute.
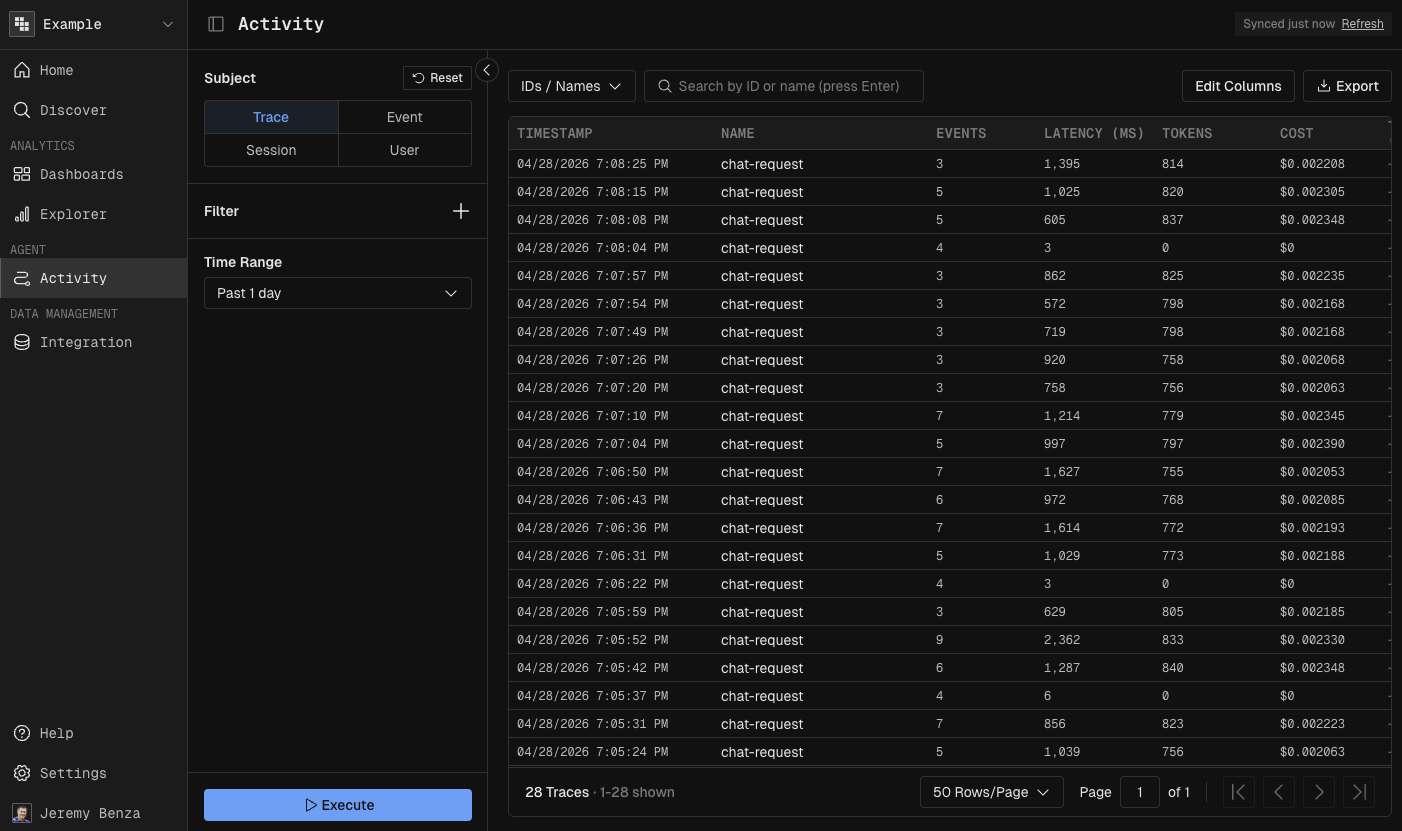
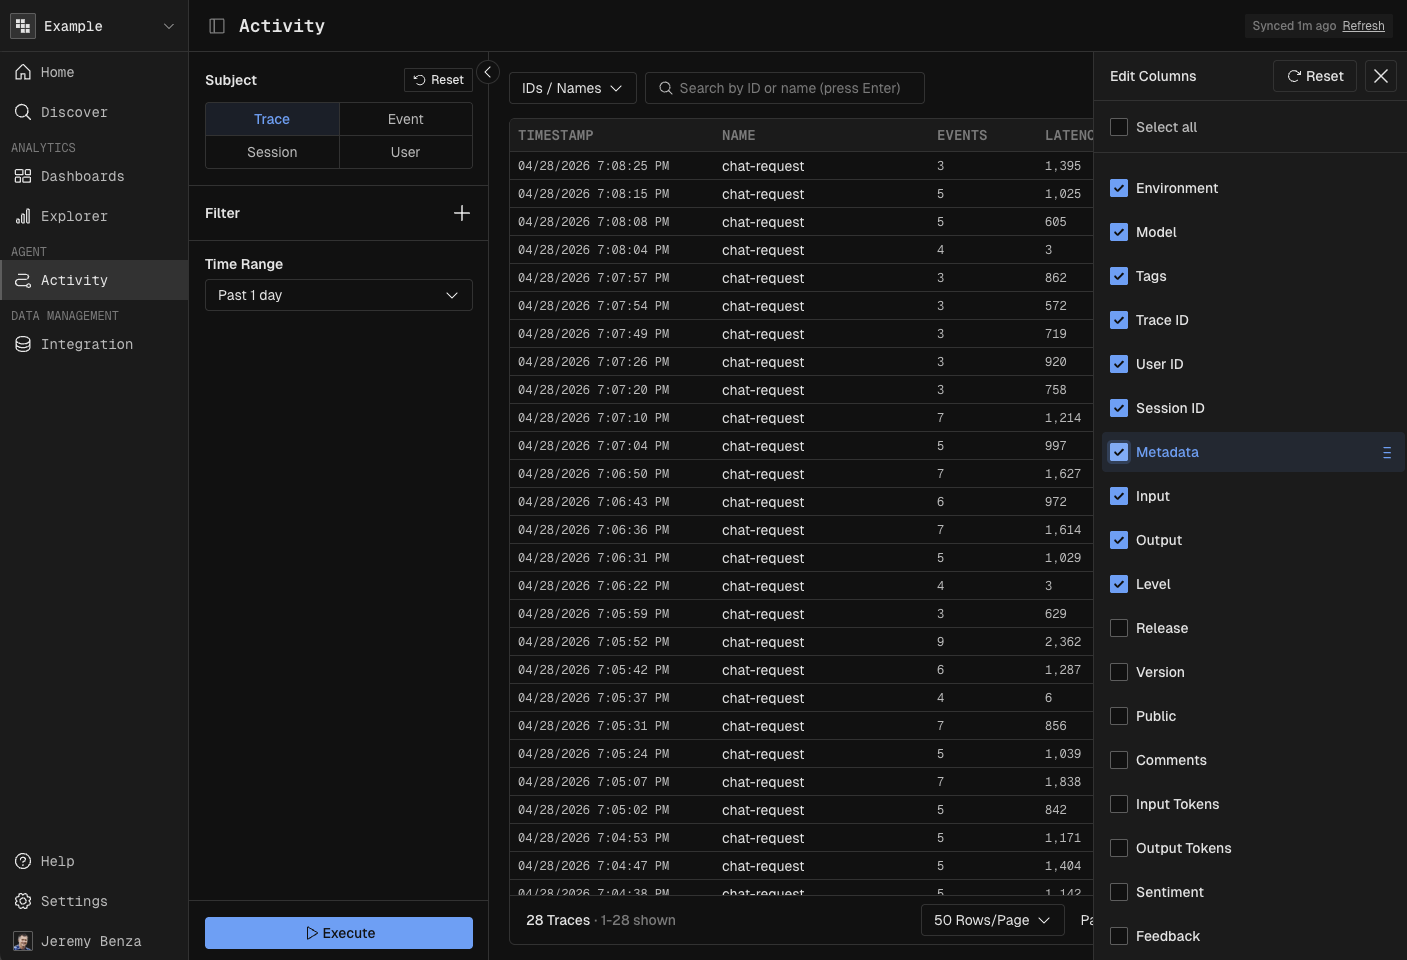
Shape the grid to your workflow
Use the search bar at the top of the grid to narrow the current result set.
Click the column picker to add columns you care about (latency, cost, intent, sentiment, etc.).
Drag column headers to re-arrange the order.
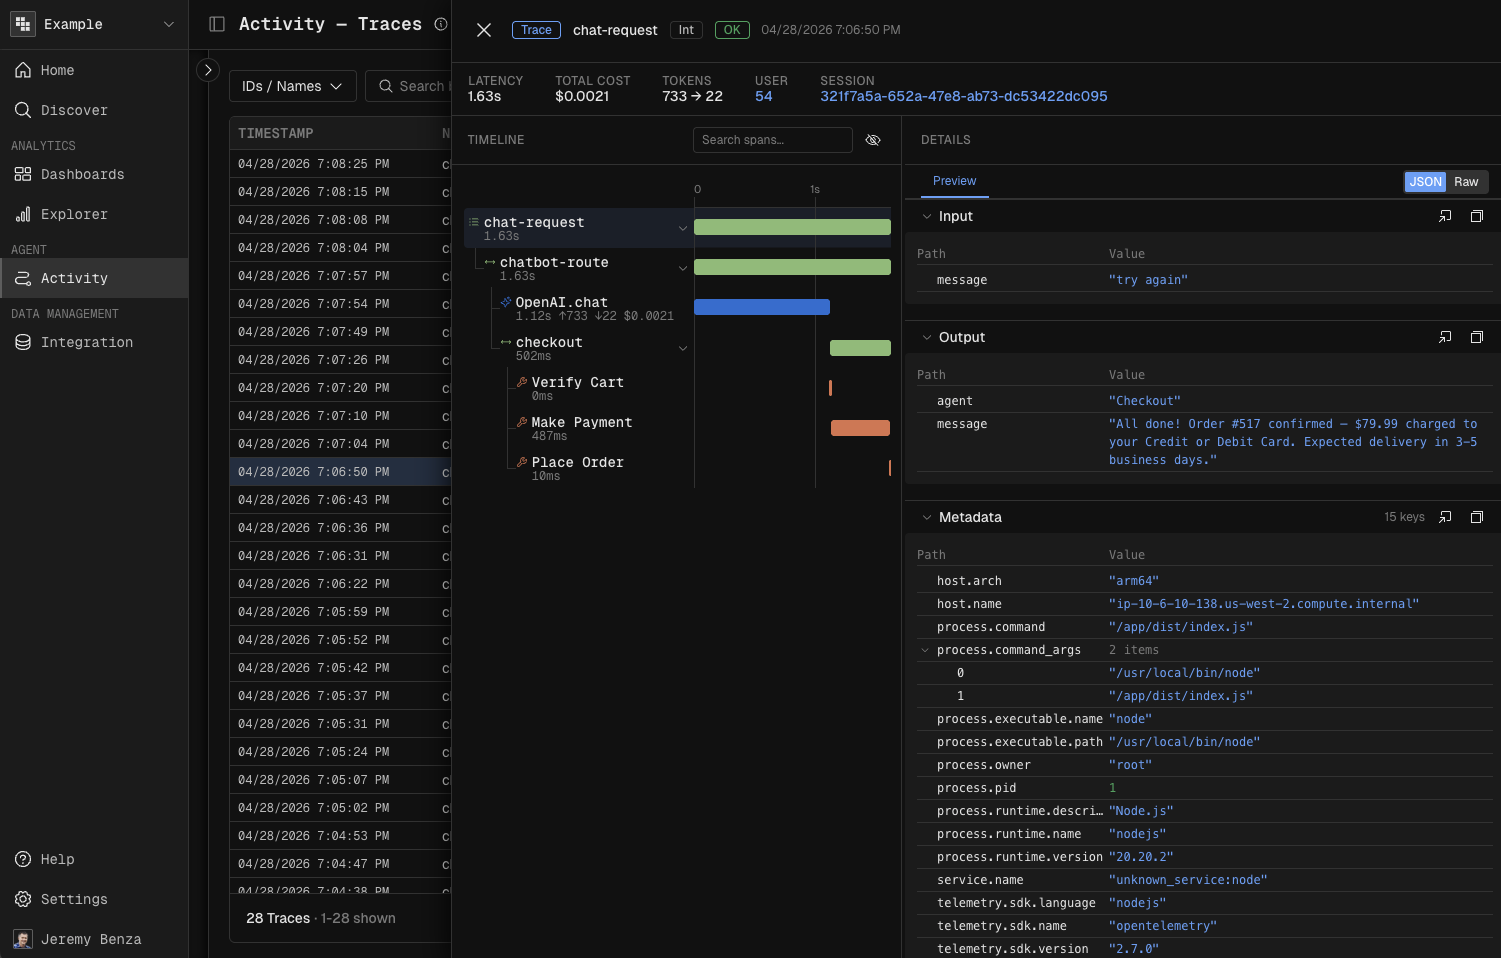
Inspect a single trace
Click any row in the grid.
Review the detail panel — trace metadata, individual events, associated user, and session.
Check latency and cost per event in the event timeline.
Scroll to the Input and Output sections to see exactly what went in and what came back.
Drill into a user or session
Inside the trace detail view, click the linked user or session.
Kubit takes you to that entity's dedicated view.
To see every trace associated with that user, click the user ID.
Next steps
Now that you understand how users interact with Atlas, build dashboards and reports to track these patterns over time.