kubit-inspect
Find and investigate Kubit entities — users, sessions, traces, and events. Use it to debug failures, drill into specific records, or navigate between related entities.
What it does
kubit-inspect is your tool for specific lookups and investigations. You point it at an entity (or a filter), and it returns a summary plus the matching records.
Kubit entities are hierarchical: user → sessions → traces → events
You can start at any level and navigate down. Inspect a user to see their sessions; inspect a session to see its traces; inspect a trace to see its events.
Looking for trends or aggregates? Use kubit-report instead. kubit-inspect is for finding and examining specific records, not for analytics over time.
Prerequisites
A connected workspace. Run kubit-connect first if you haven't already.
Usage
❯
/kubit-inspect[<natural language query>]
You can write the query however feels natural — entity type, filters, and time ranges are all parsed for you. No need to memorize flag syntax.
Examples
Look up a specific user
❯
/kubit-inspectuser alex@acme.com
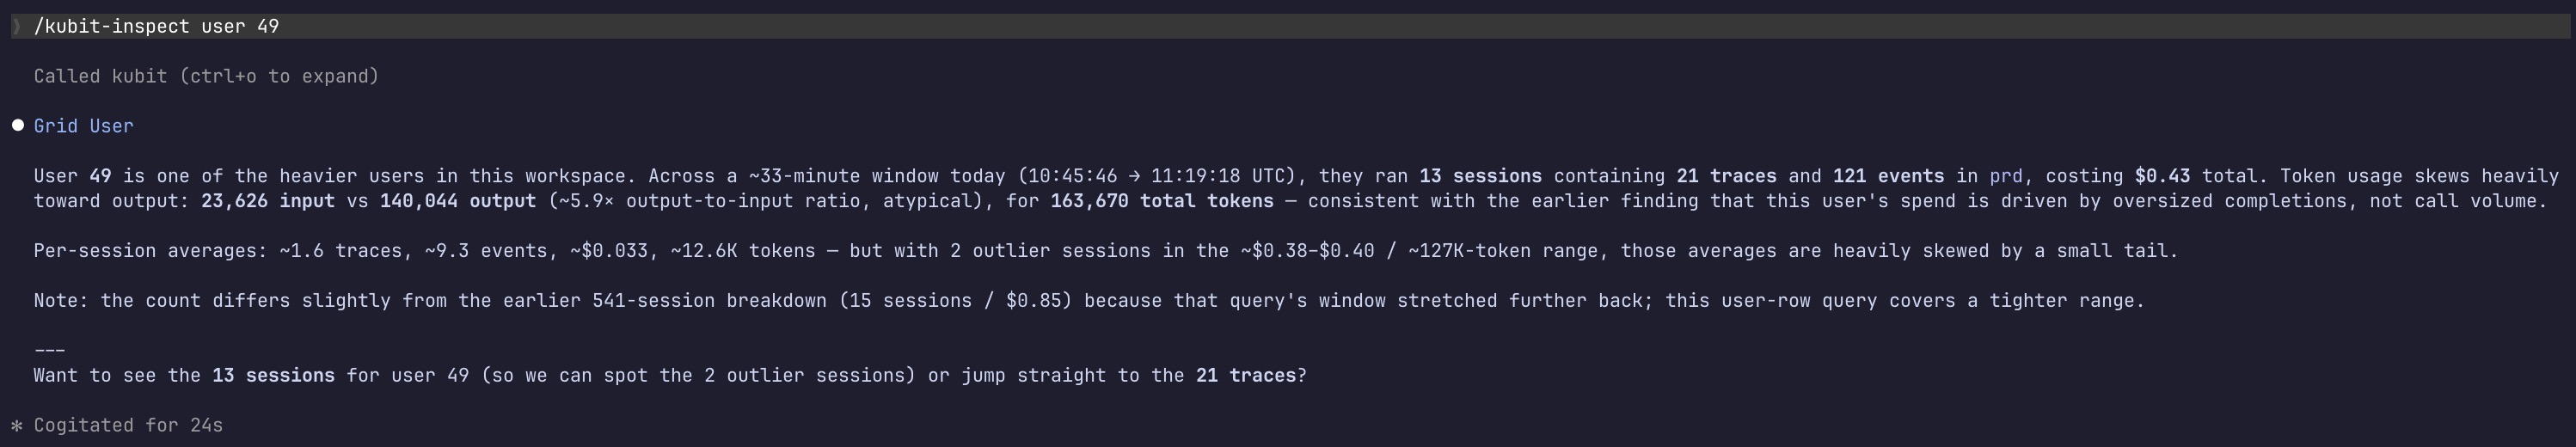
Returns a summary for that user: total cost, latency, token usage, top errors, session count, and most common intent. From there you can drill into their sessions or traces.
Navigate between entities
❯
/kubit-inspectsessions for alex@acme.com❯
/kubit-inspecttraces in sessionsess_abc123❯
/kubit-inspectevents fired in trace1cd9d647
Follow-up queries like these work naturally — kubit-inspect carries forward the entity you were just looking at.
Filter traces
❯
/kubit-inspectfailed traces with intent Checkout since yesterday
Returns a pattern summary across the matching traces (avg cost, avg latency, common error, common model) followed by a list of individual traces. The total match count is always shown alongside the number displayed.
Ask follow-up questions
❯
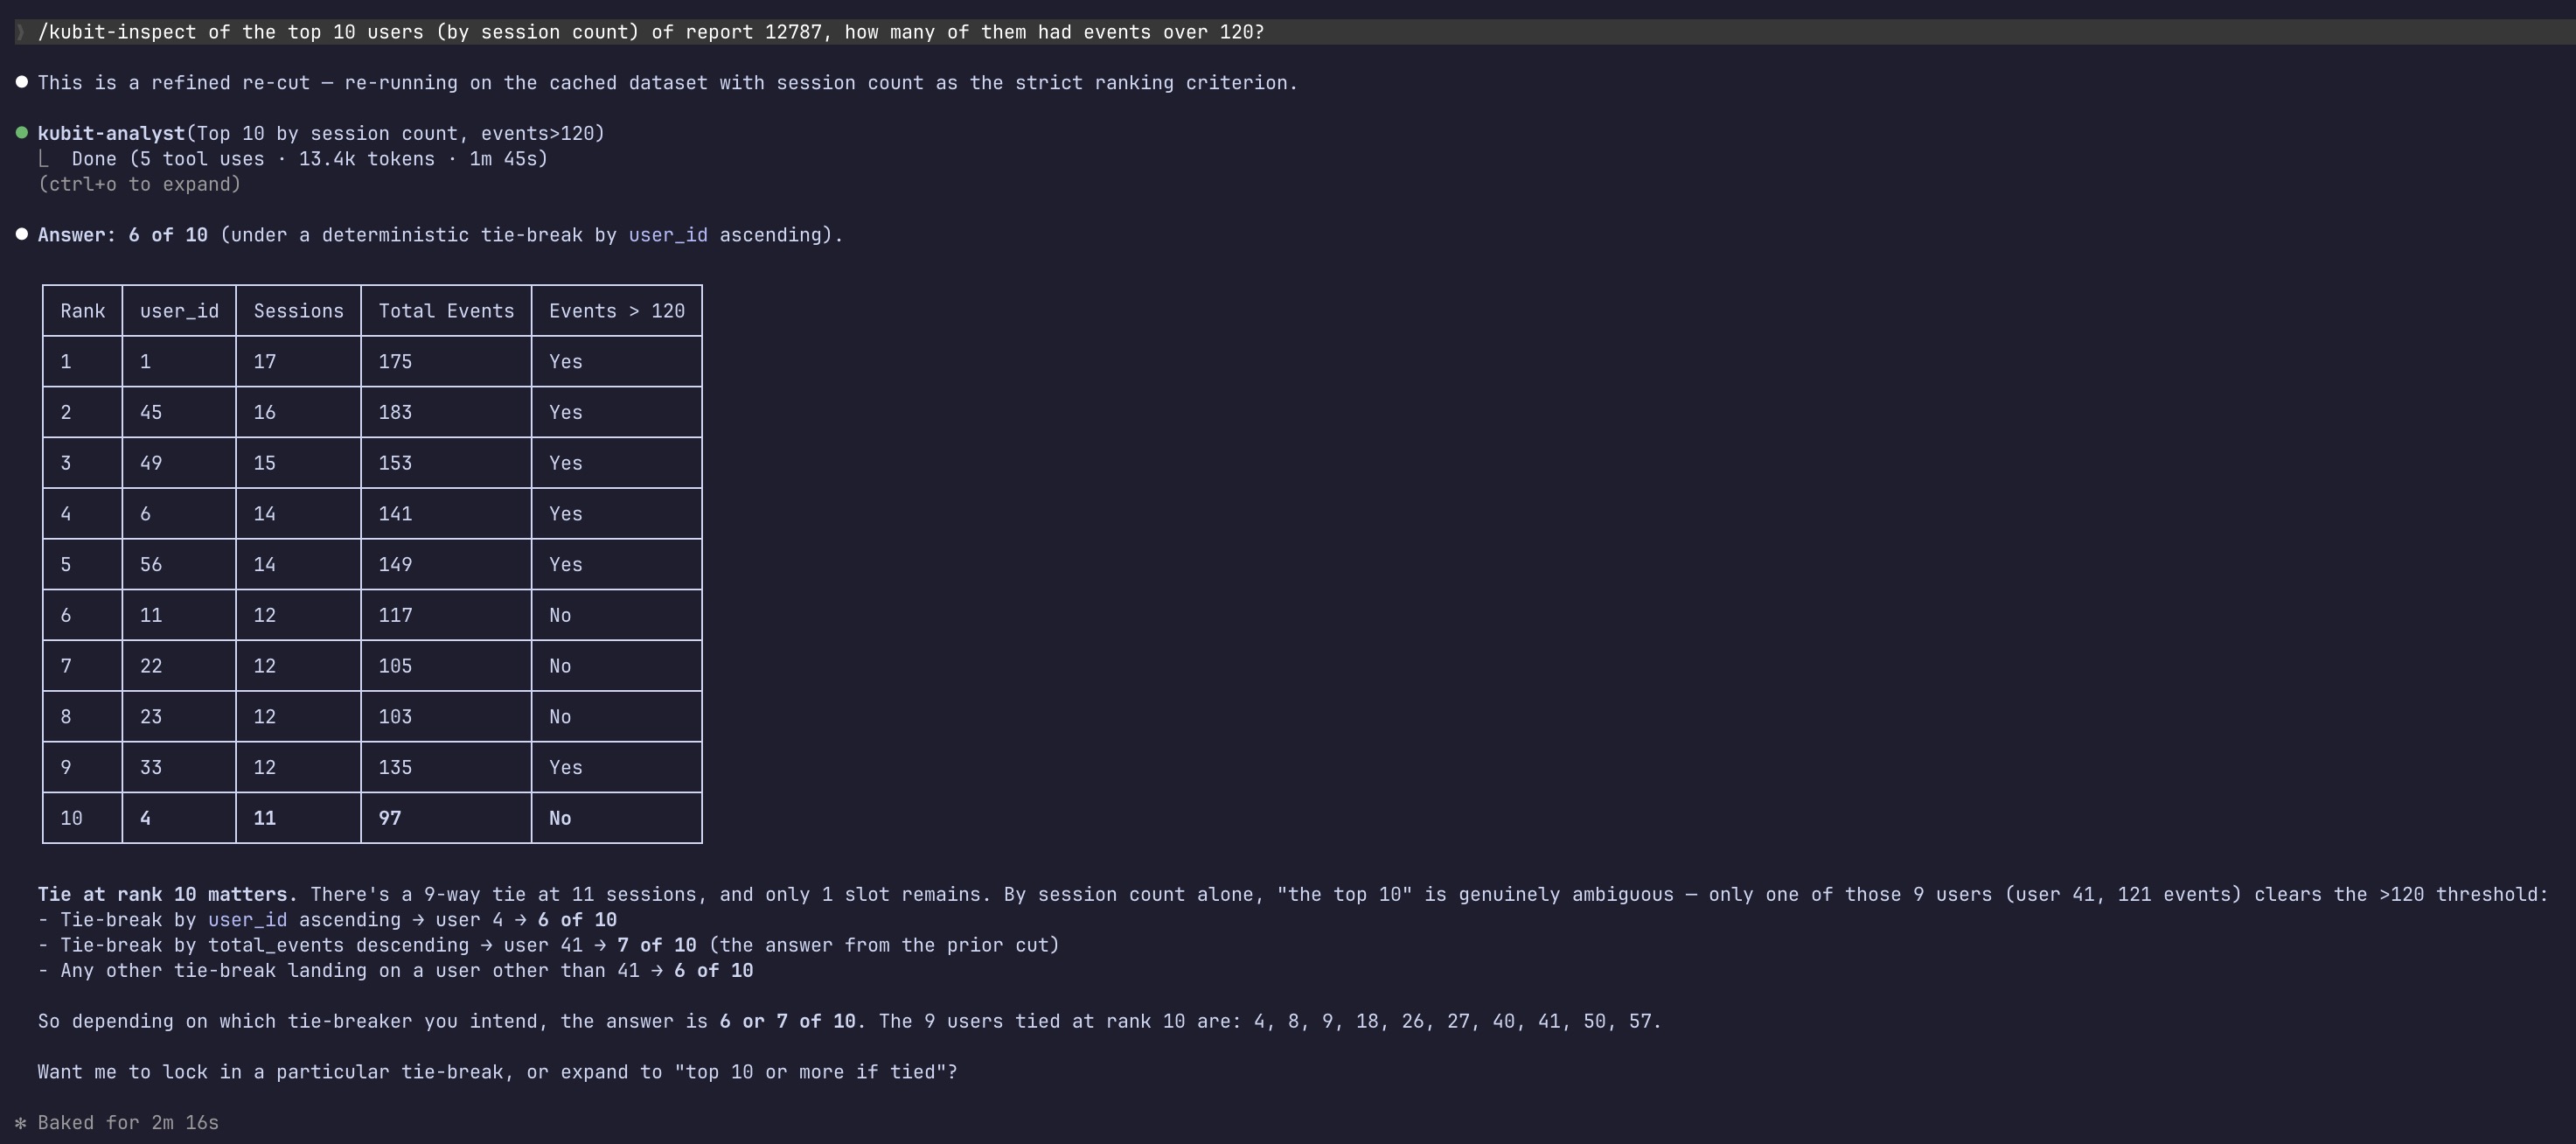
/kubit-inspectwhich of those traces had latency over 5s?
Follow-up questions that narrow or re-cut the same dataset reuse the cached results — they're faster and don't re-hit the MCP.
Example output for breaking down by failed traces:
Drill into a report segment
If you've just run a kubit-report (or pasted a report URL into the chat), kubit-inspect can pick up that context and zoom into the segment you're asking about.
❯
/kubit-inspectusers who dropped off at payment in that funnel
Output behavior
Single entity lookups return a conversational summary of the key fields — cost, latency, tokens, status, errors — with context for what they mean.
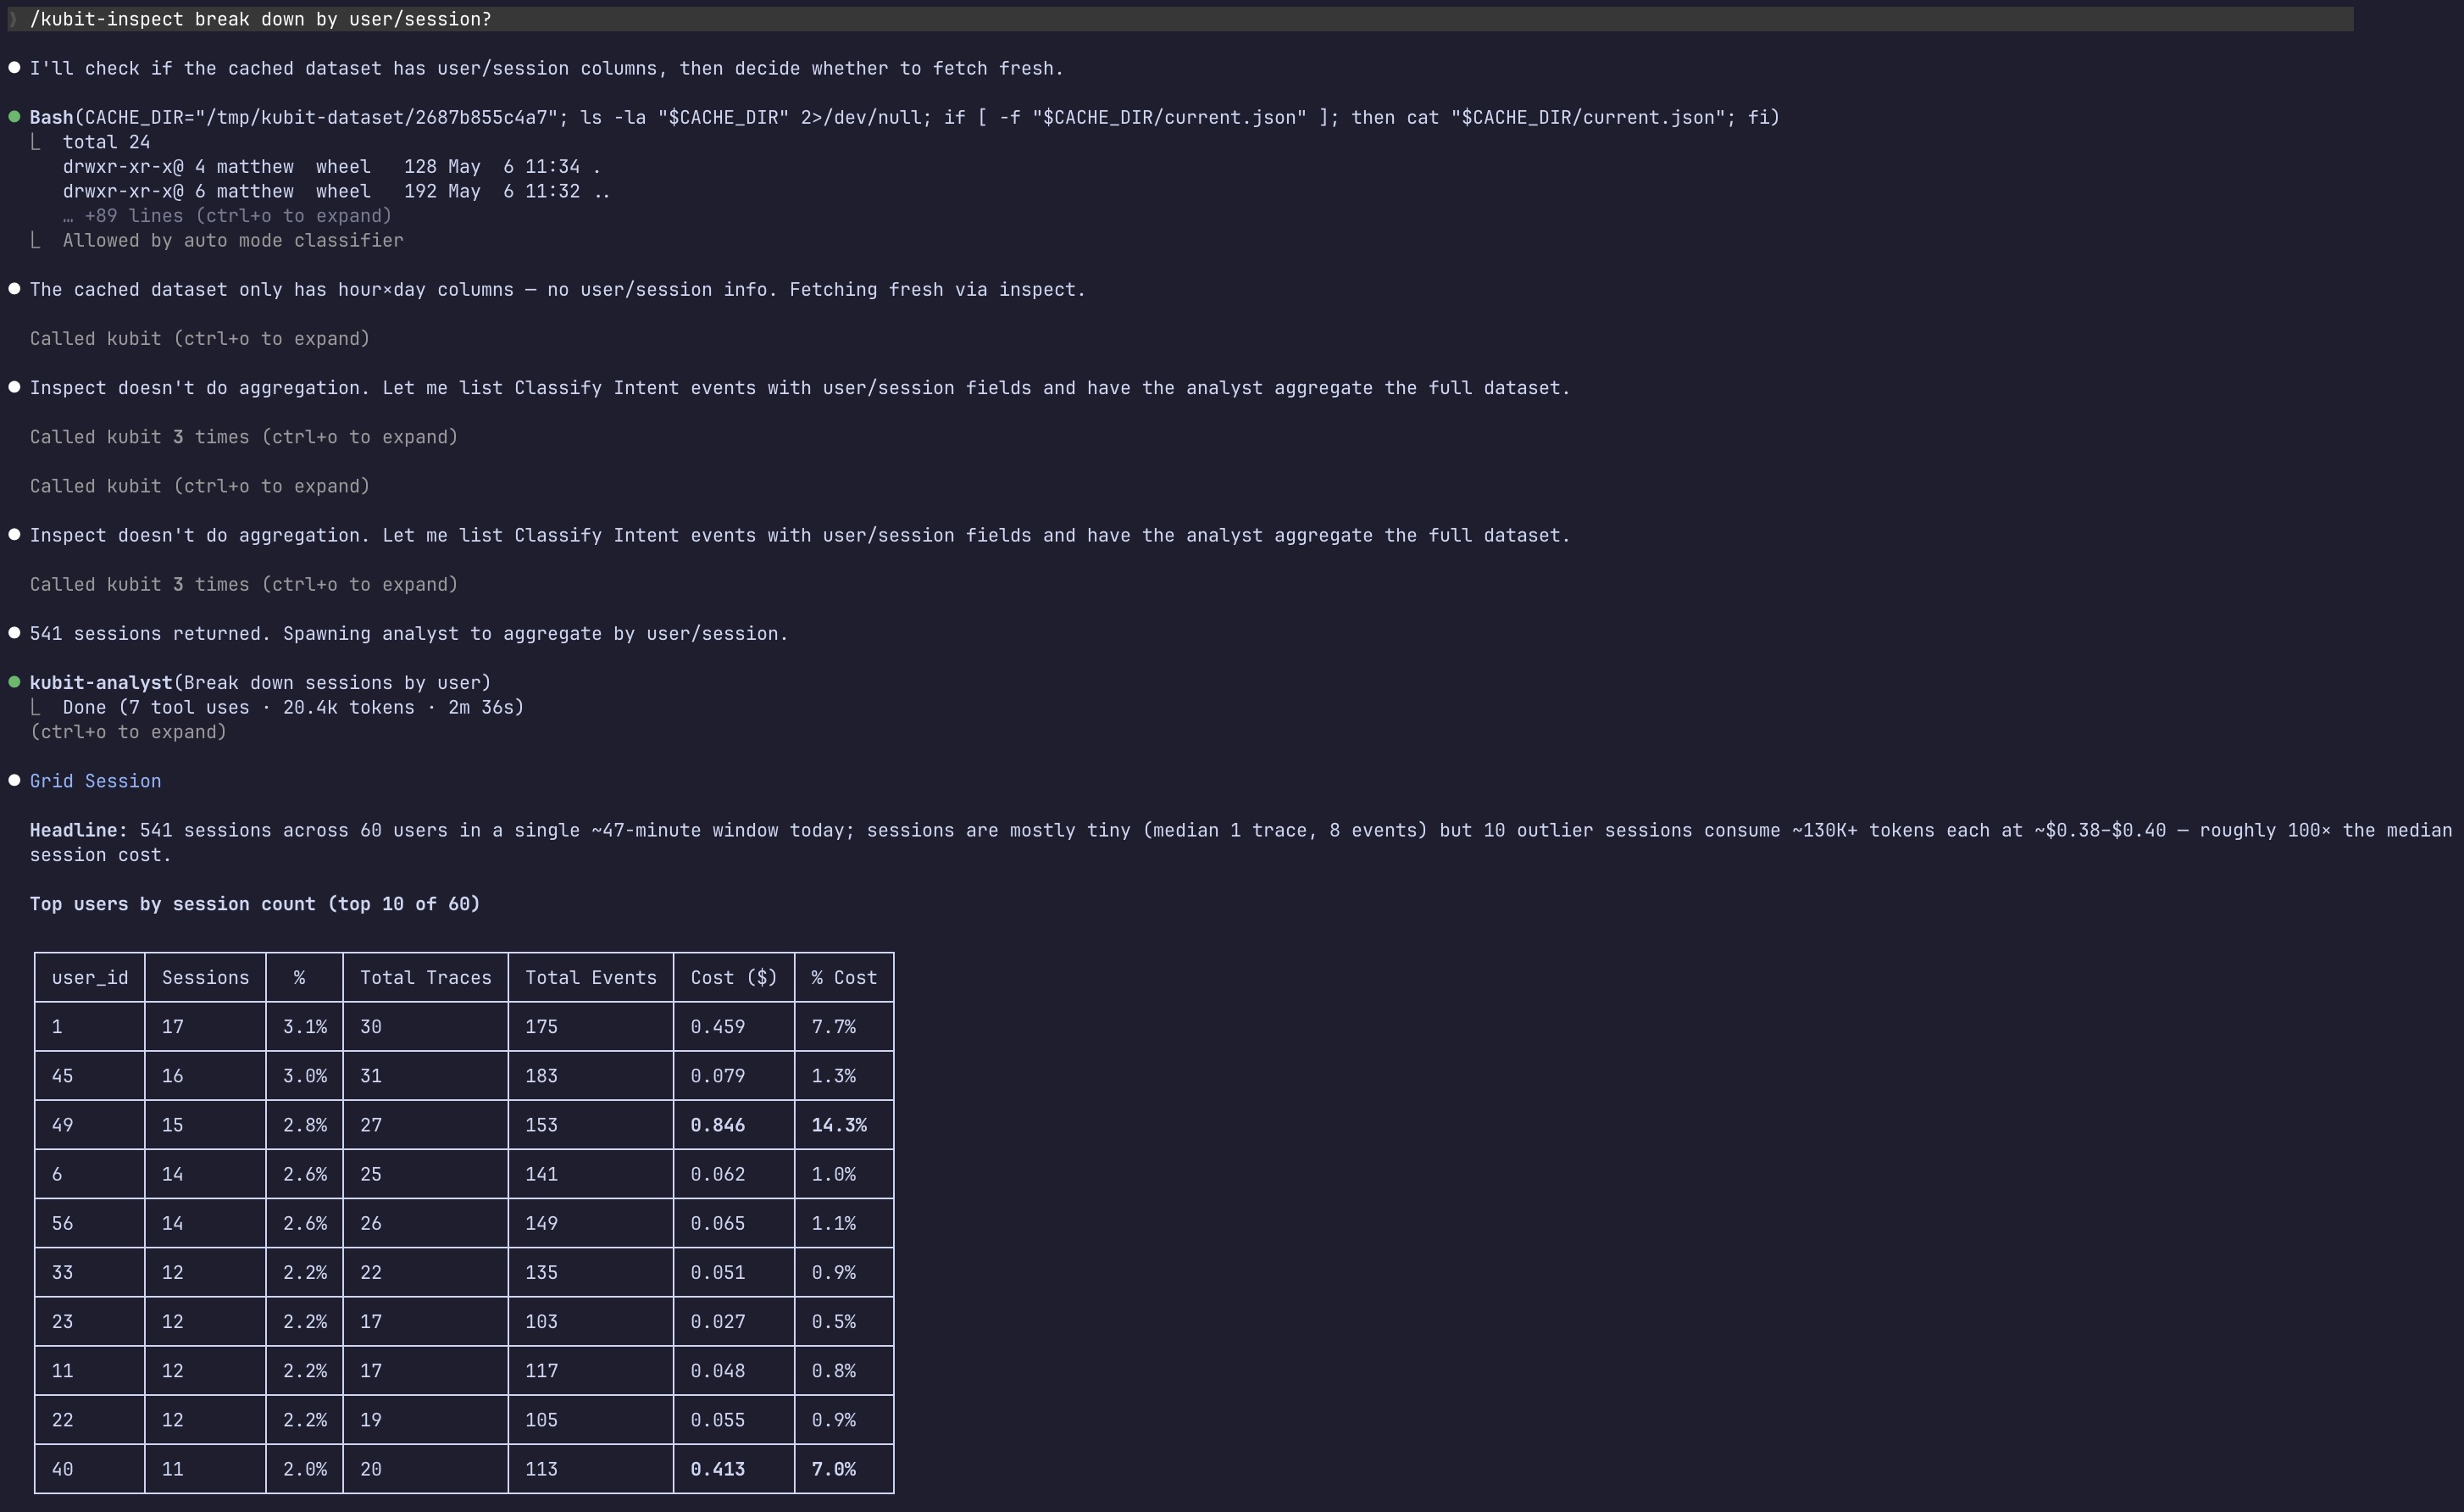
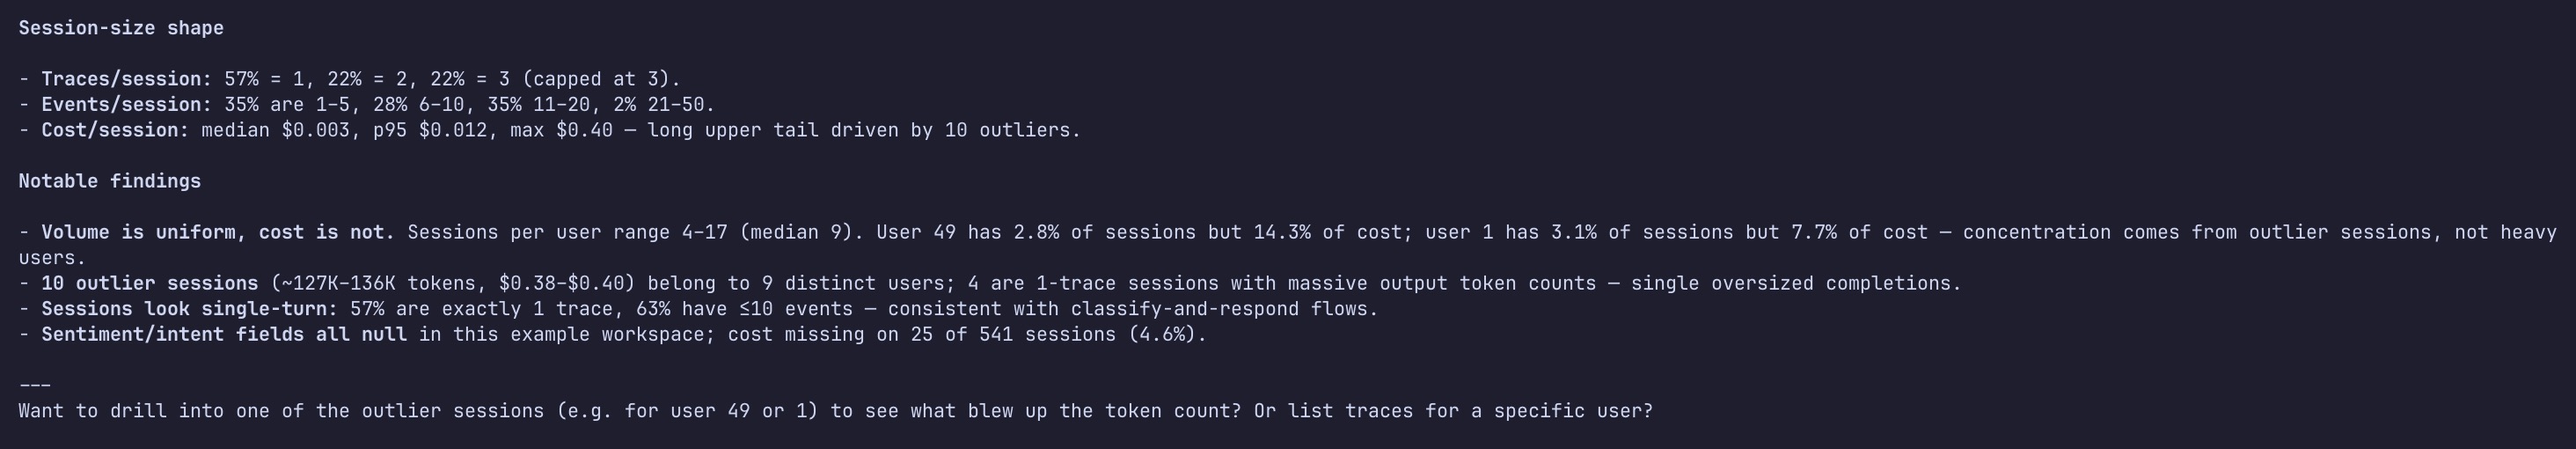
Multi-result queries lead with the pattern (what's broken, expensive, or slow) and follow with a compact list of individual records.
Large datasets are analyzed against the full export rather than a sample, so the numbers reflect everything that matched, not just the first ~100 rows.
Suggested next steps
After an inspection, you'll typically see a follow-up suggestion:
You inspected... | Suggested next step |
|---|---|
A user | Drill into their sessions or traces |
A session | Drill into its traces |
A trace | Drill into its events |
Multiple traces | Run |
Failures or errors | Run |
These are suggestions only — nothing runs automatically.
Notes
If a query returns no results, try broadening the time range or double-checking filter values (intent names, user IDs, etc. are case-sensitive).
Some query types don't support full-dataset analysis. When that's the case, you'll see a note that the summary is based on a limited sample.
If a query is ambiguous about which entity type you mean (users, sessions, traces, or events), you'll be asked to pick rather than have one guessed for you.