Agent Observability
Kubit maps user behavior directly to your LLM traces. Standard observability tools tell you what broke (latency, token limits, system errors), but they cannot tell you why the user was frustrated.
Kubit solves this by stitching together clickstream events, LLM traces, tool calls, and prompt versions into a single source of truth within your cloud data warehouse. This guide outlines the core observability features, activity views, and metrics available to developers and AI engineers.
Agent Activity: Traces, Spans, and Sessions
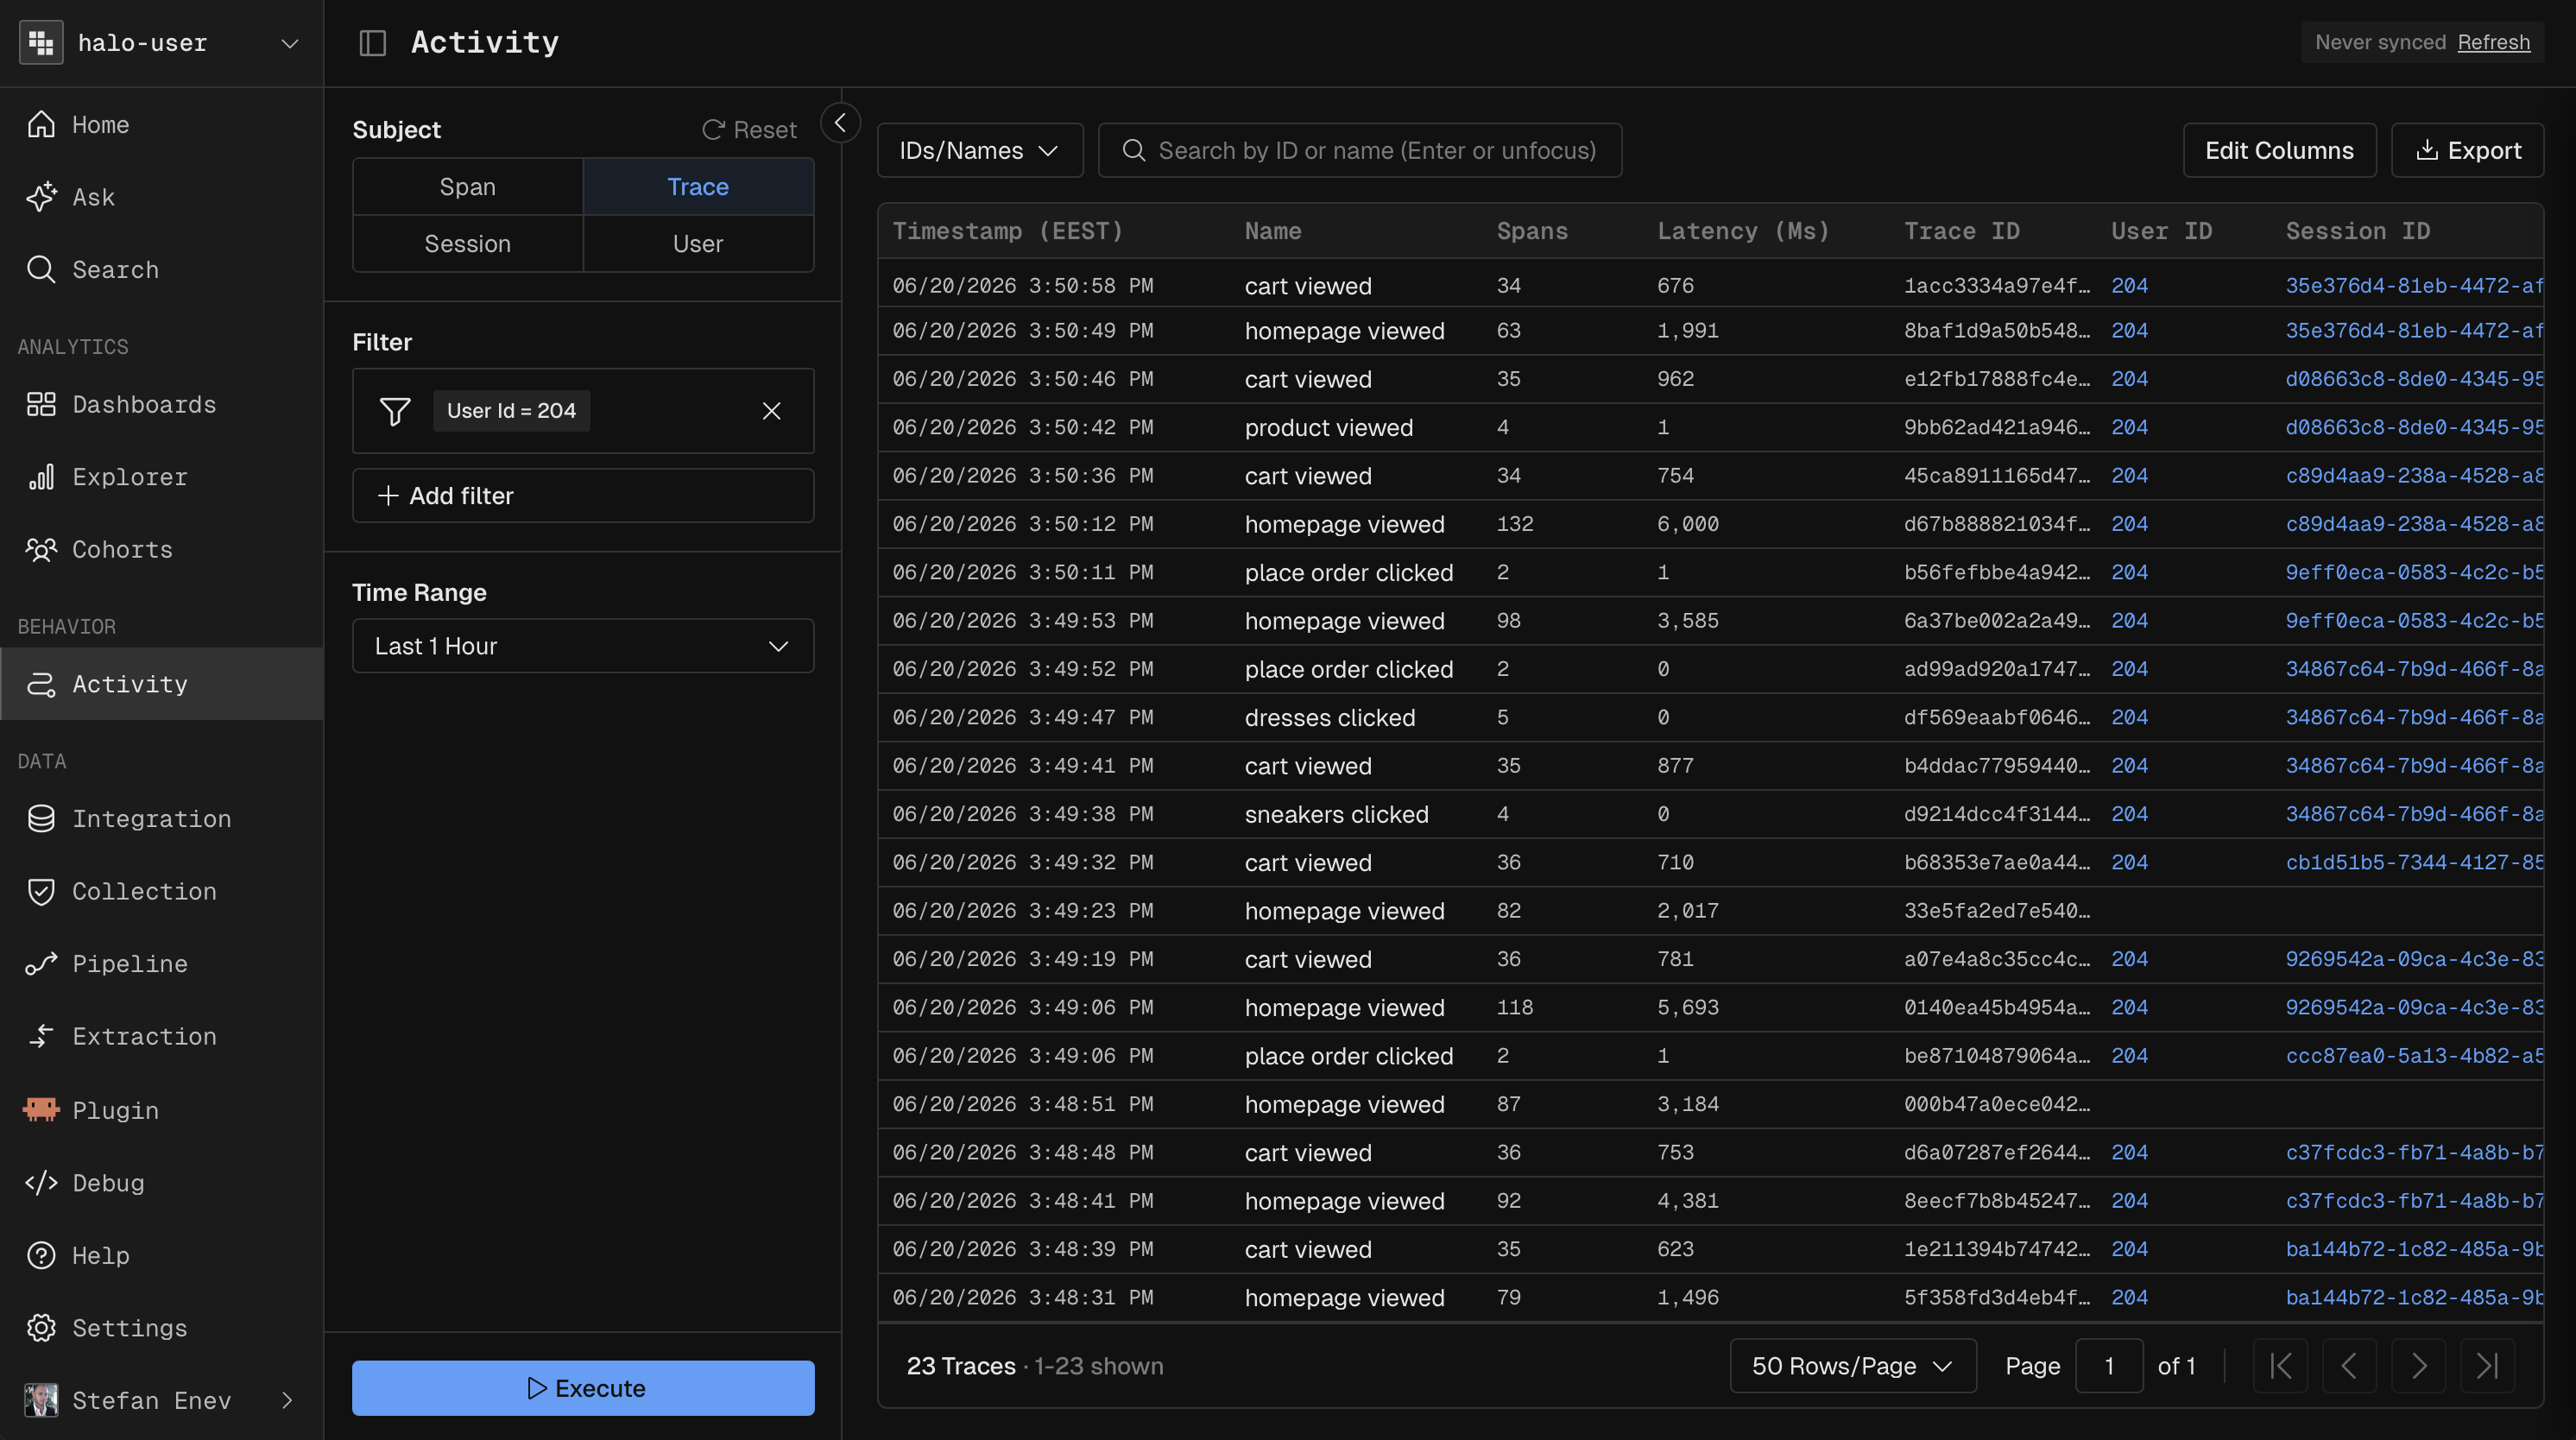
The Agent Activity view eliminates the need to bounce between raw JSON logs and external analytics dashboards. It provides full context by correlating human user behavior directly with your agent's reasoning chain.
Trace & Span Visibility: View the complete lifecycle of an agent interaction. Drill down into individual spans to inspect execution paths, internal routing logic, and latency bottlenecks.
Tool Call Trajectories: See exactly which tools were invoked, the payload sent, and the API responses received during multi-step reasoning processes.
Prompt & Response Pairs: Inspect the exact prompt versions and generated completions side-by-side with execution metadata.
Contextual User Behavior: View exactly what the user did before and after the agent interaction (e.g., rage clicking, abandoning a funnel, or completing a purchase) directly alongside the trace.
Observability Dashboards & Metrics
Kubit goes beyond basic application performance monitoring (APM) by applying Conversation Intelligence to 100% of your traces with zero sampling. This allows you to track business-level metrics alongside system performance.
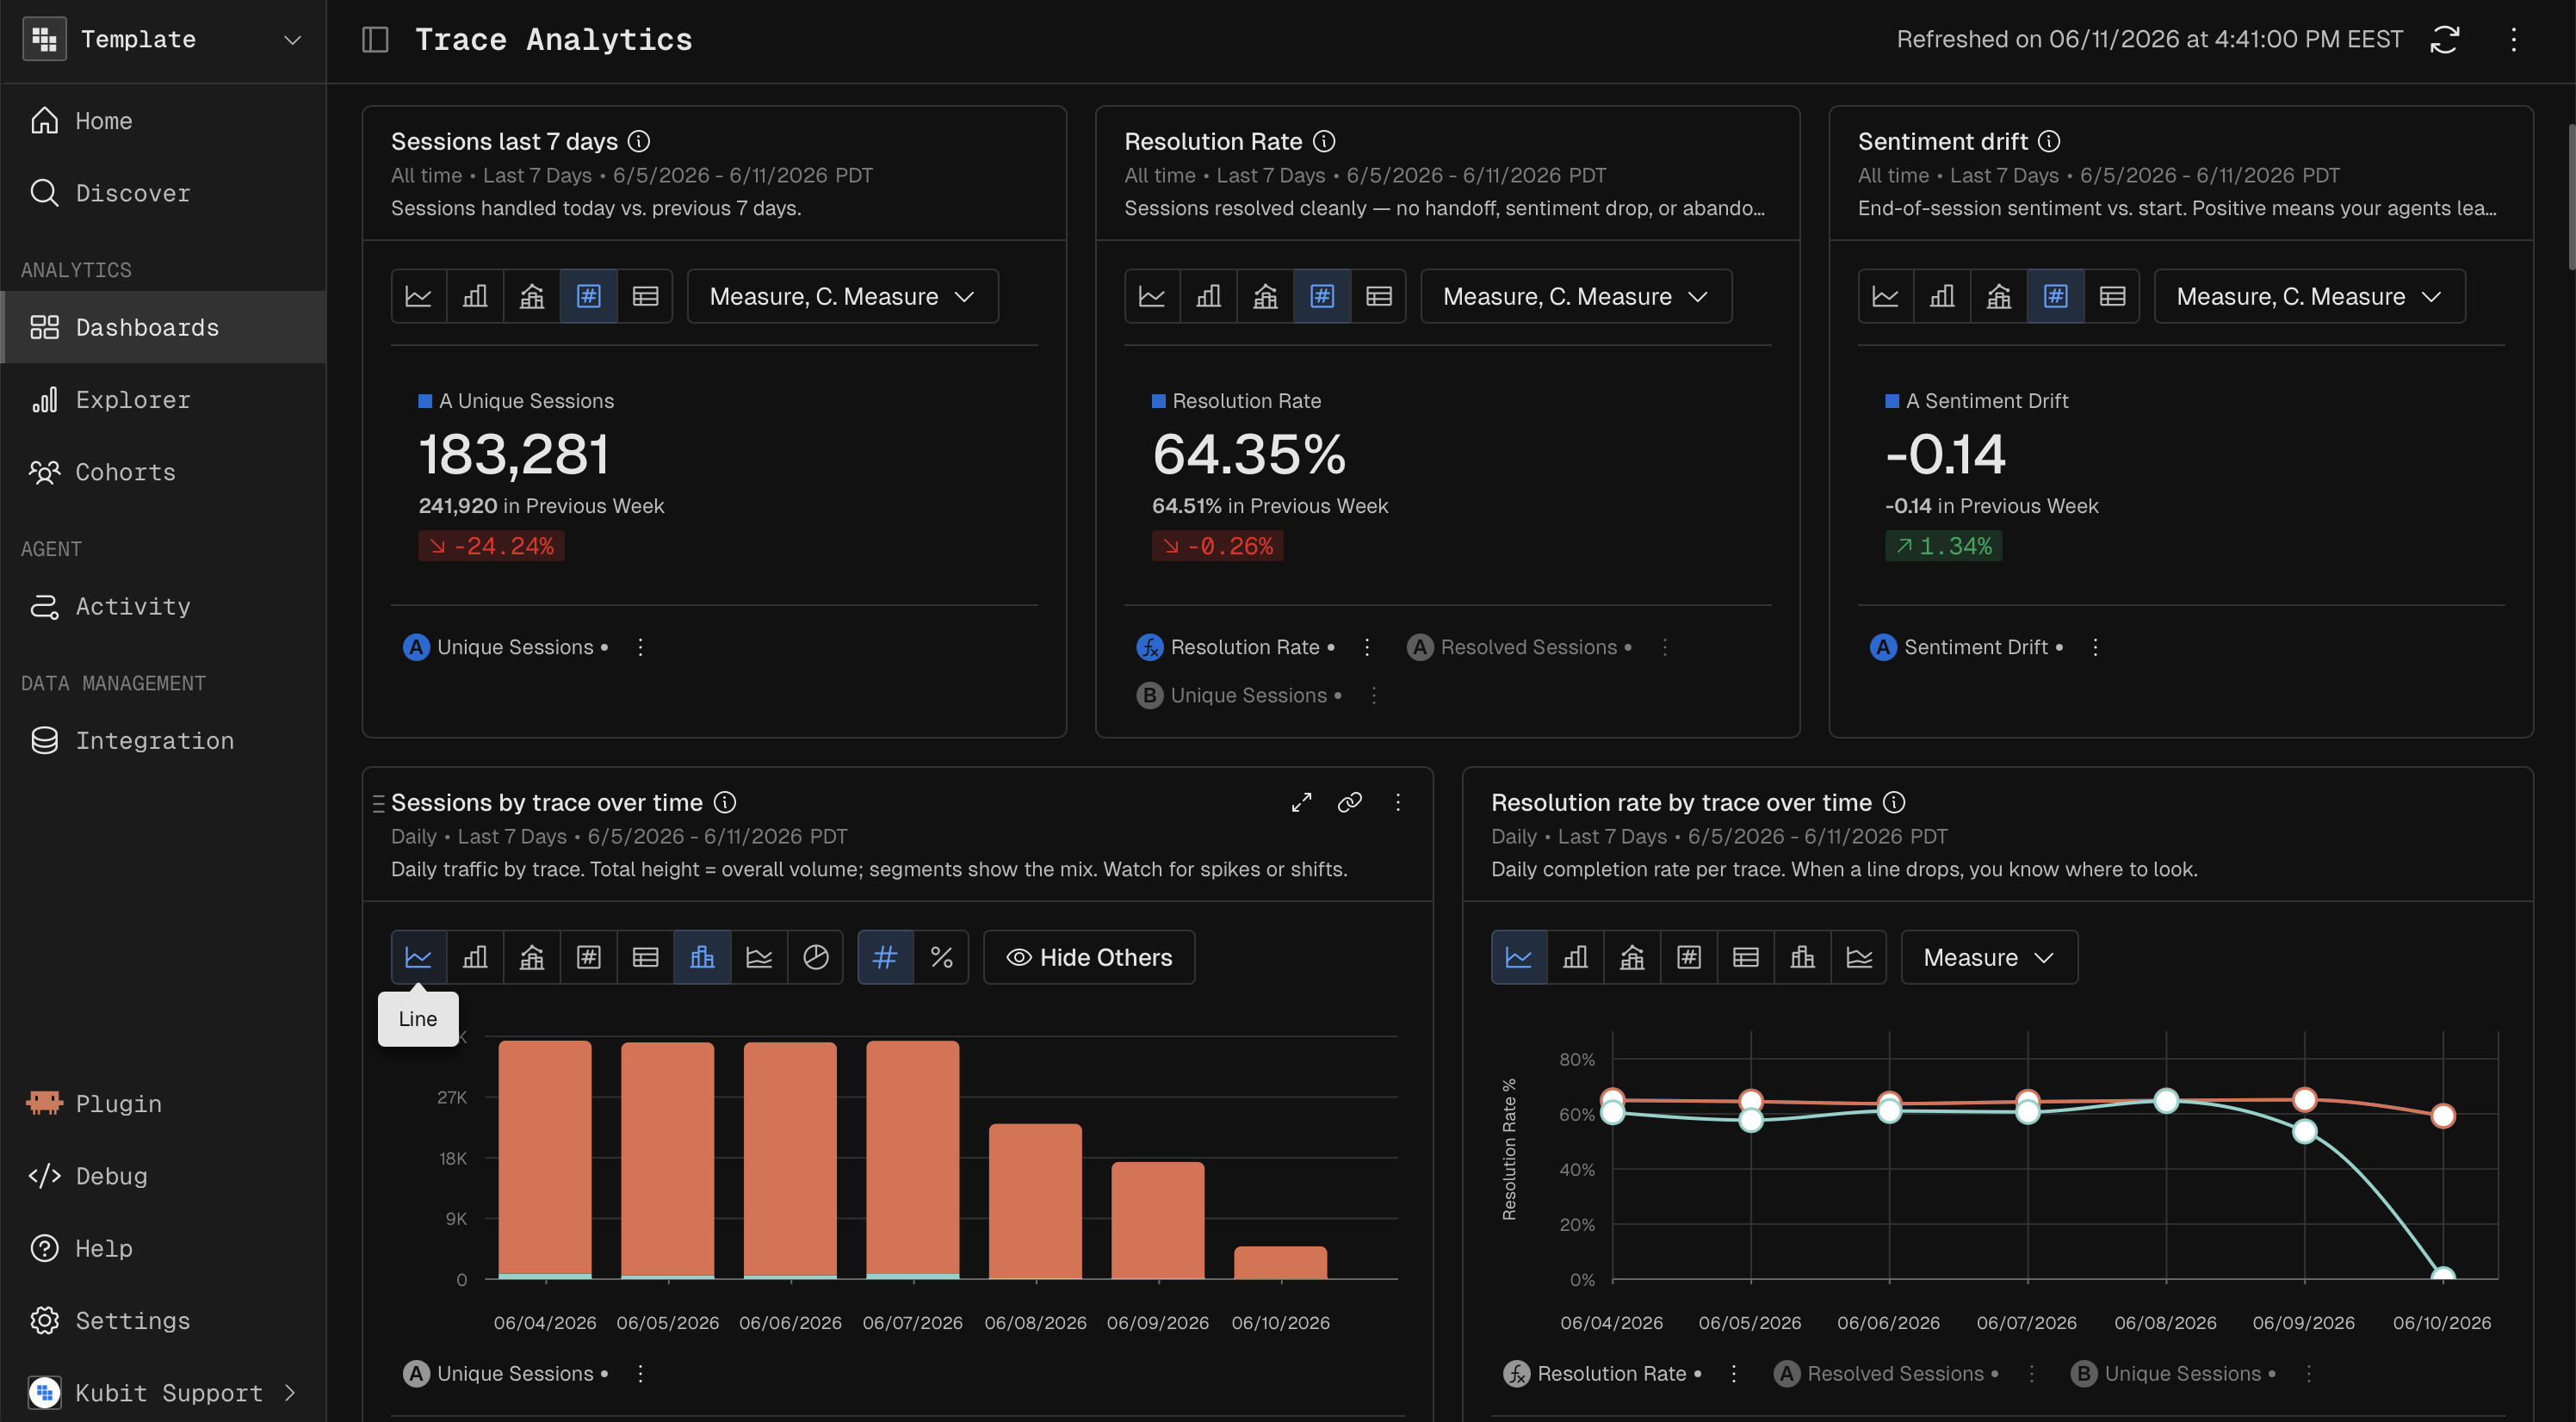
Your Observability Dashboards surface the following key metrics:
Intent: Automatically extracts and categorizes the underlying goal of the user's prompt, allowing you to filter traces and errors by specific use cases.
Sentiment (Friction & Delight Signals): Analyzes the text and subsequent user actions to detect frustration (e.g., negative responses, retry loops) or satisfaction.
Resolution Rate: Tracks whether the agent successfully solved the user's problem, required a human handoff, or resulted in session abandonment.
Performance & Cost: Monitors token limits, prompt/completion token counts, system errors, and execution latency, allowing you to optimize expensive agent workflows.
Solve It Where You Build It (MCP Integration)
Kubit turns your observability data into an active debugging mechanism through the Model Context Protocol (MCP). Instead of forcing you to hunt for insights in a UI, Kubit brings the analytics headless directly to your IDE.
Coding Agent Integration: Feed live user intent, friction signals, and trace failures straight into Claude Code or Cursor via the Kubit Plugin
Auto-Remediation: Equip your coding agents with the live context needed to debug prompt failures, optimize tool calls, and push fixes without ever leaving your editor or opening another browser tab.
Instrumentation & Framework Support
Kubit is built to integrate smoothly into modern developer stacks without proprietary SDK lock-in.
OpenTelemetry (OTel): Instrument your AI application from scratch using standard OpenTelemetry protocols to map traces directly to client-side session IDs.
Native Integrations: Seamlessly ingest data from major LLM observability frameworks, including Langfuse, LangSmith, and Arize.
Warehouse-Native: All trace and activity data lives directly in your own data warehouse (Snowflake, Databricks, BigQuery), maintaining strict data sovereignty and security.