
Dashboards
Get oriented with the pre-built Agent Analytics dashboard, refresh data, drill into a report, and spin up a new dashboard of your own.
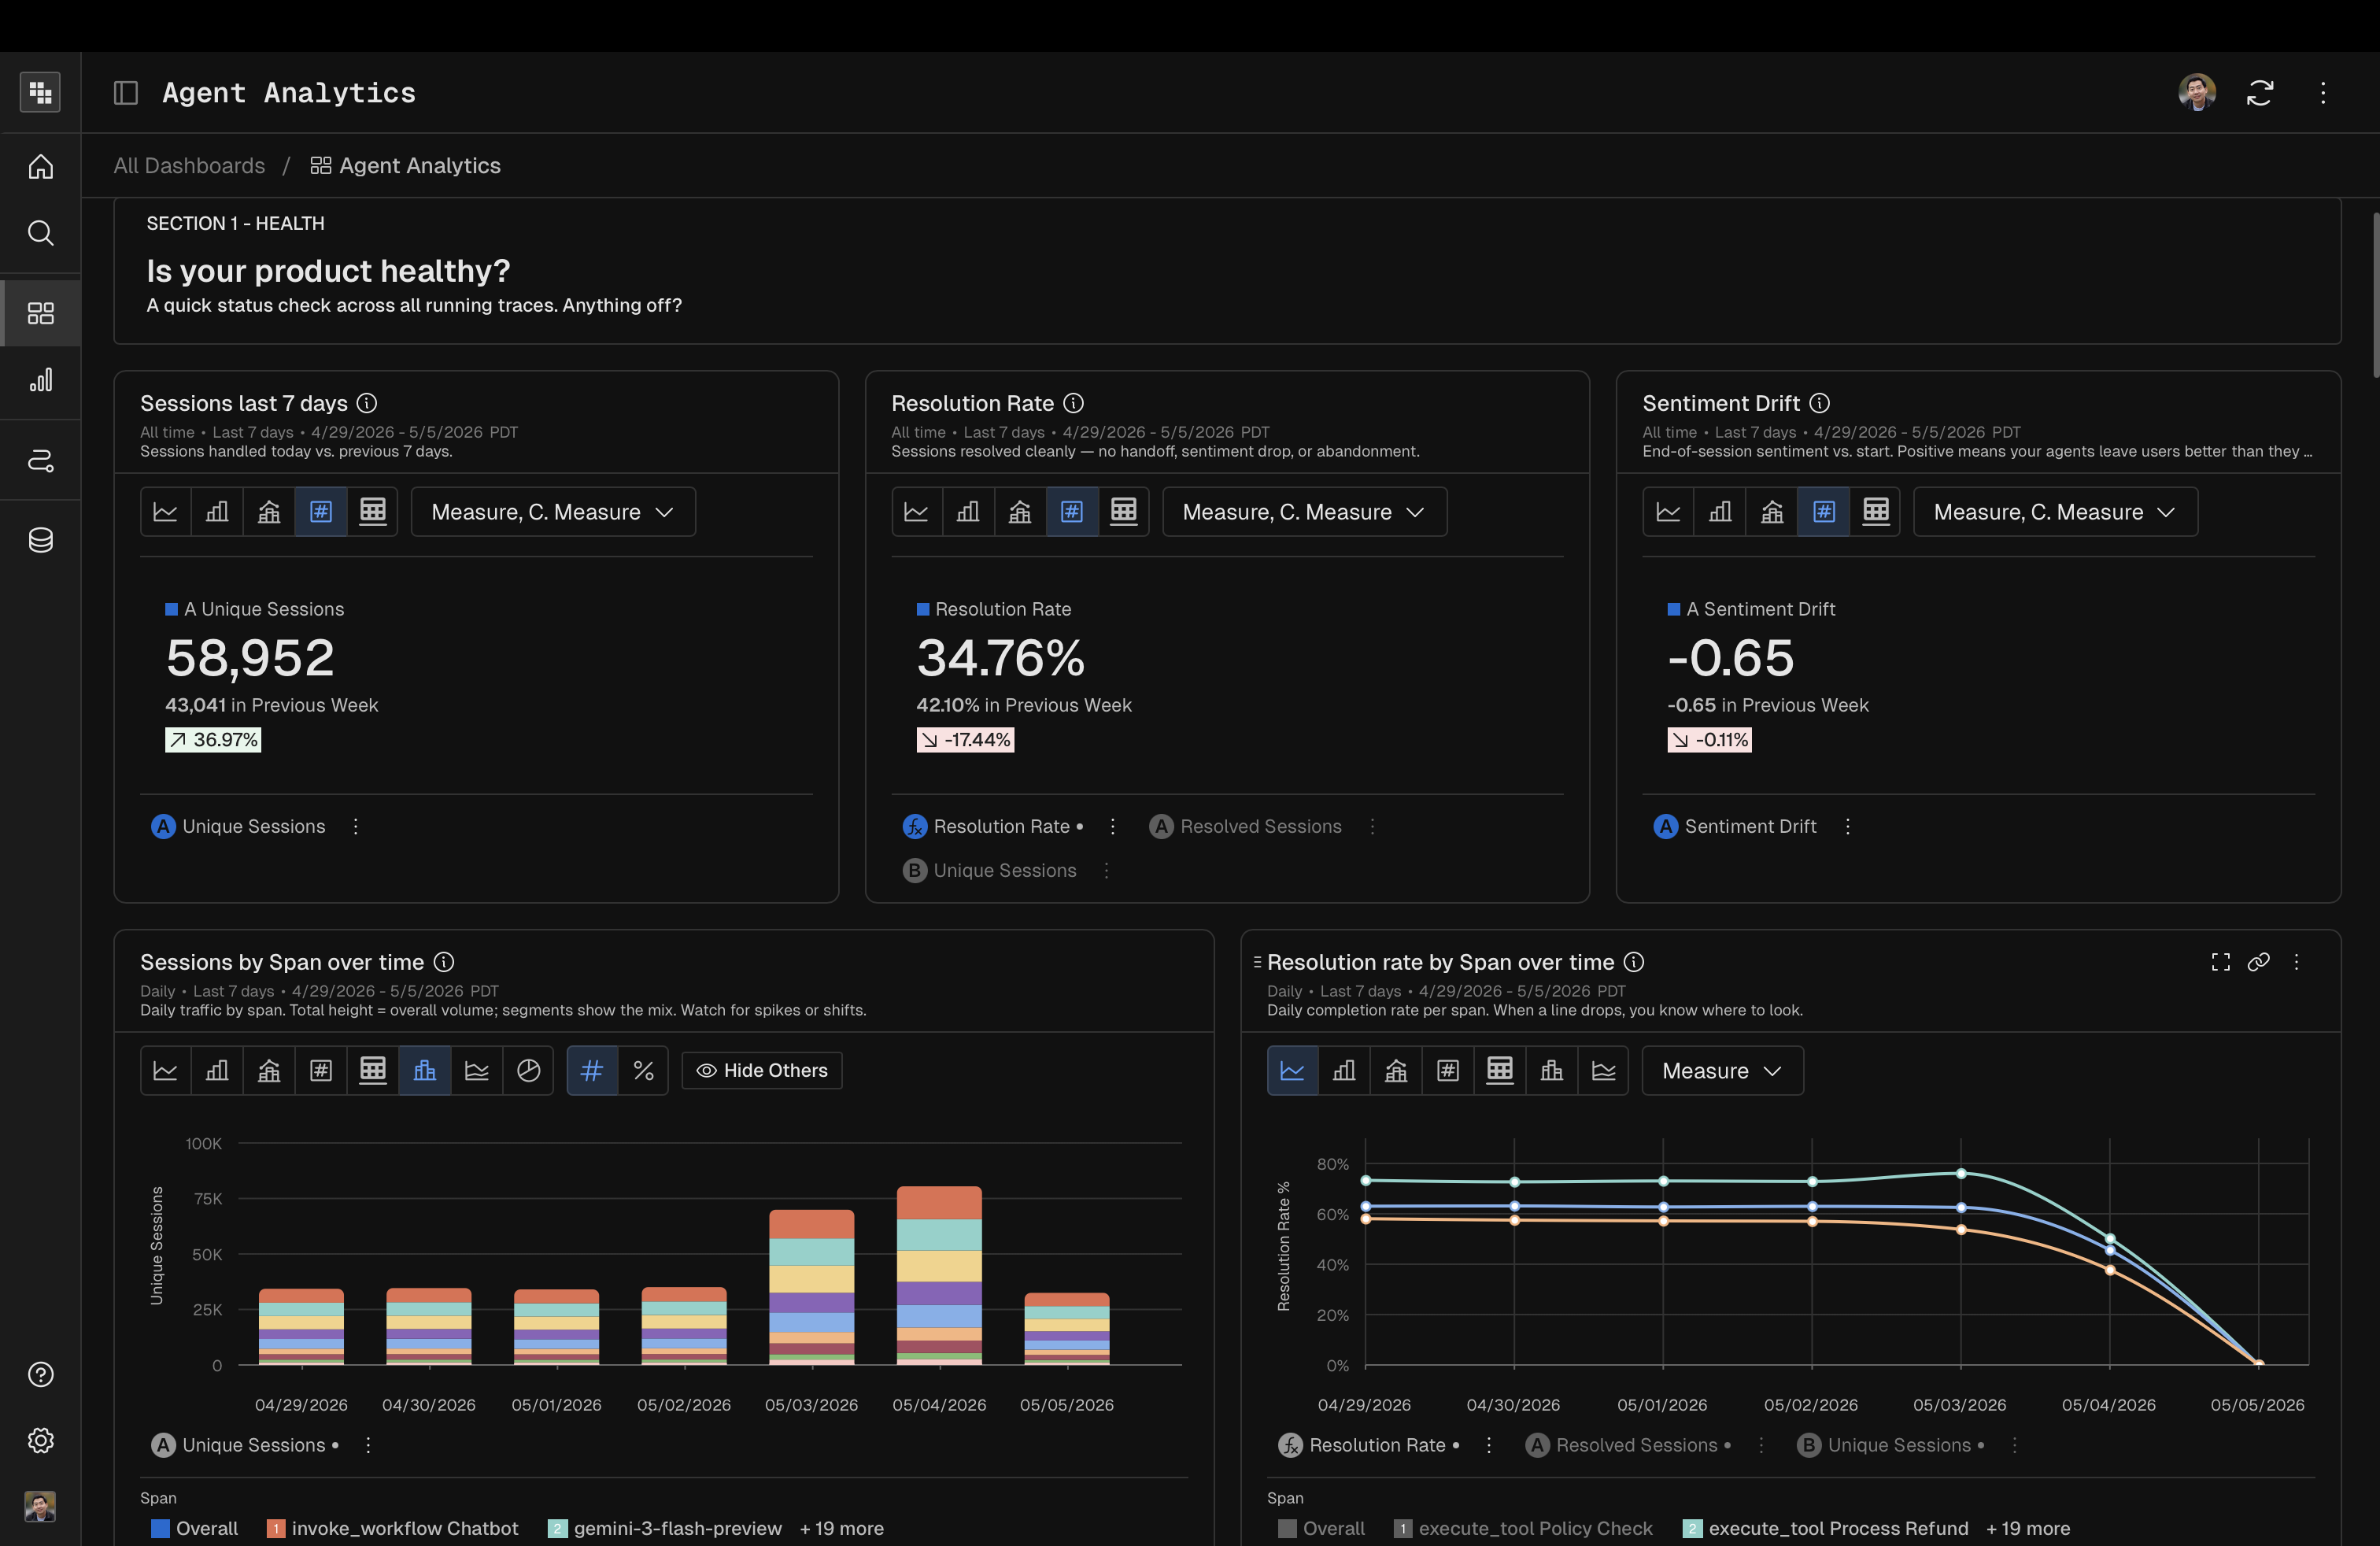
Open the Agent Analytics dashboard
Every Kubit workspace ships with a default Agent Analytics dashboard so you have something live the first time you log in.
In the left navigation, click Dashboards.
Open Agent Analytics.
This is your default view into how AI traces perform in production. In a few minutes you'll see:
Health, cost, ROI — sessions, resolution, sentiment, cost-per-resolved, trends
Trace diagnostics — scorecard, friction, errors, tool failures, latency
Intent and user signals — goals, stuck points, delights, retention
Each section answers one question. Start at the top, drill into anything that looks off.
Refresh the data
Dashboards in Kubit are not live by default — what you see on screen is the data from the last refresh.
In the top-right corner of the dashboard, click the refresh icon.
Wait for the reports to reload with the latest data.

Custom dashboard and report schedules are coming soon. Until then, refreshing manually is how you keep the view current.
Drill into a report
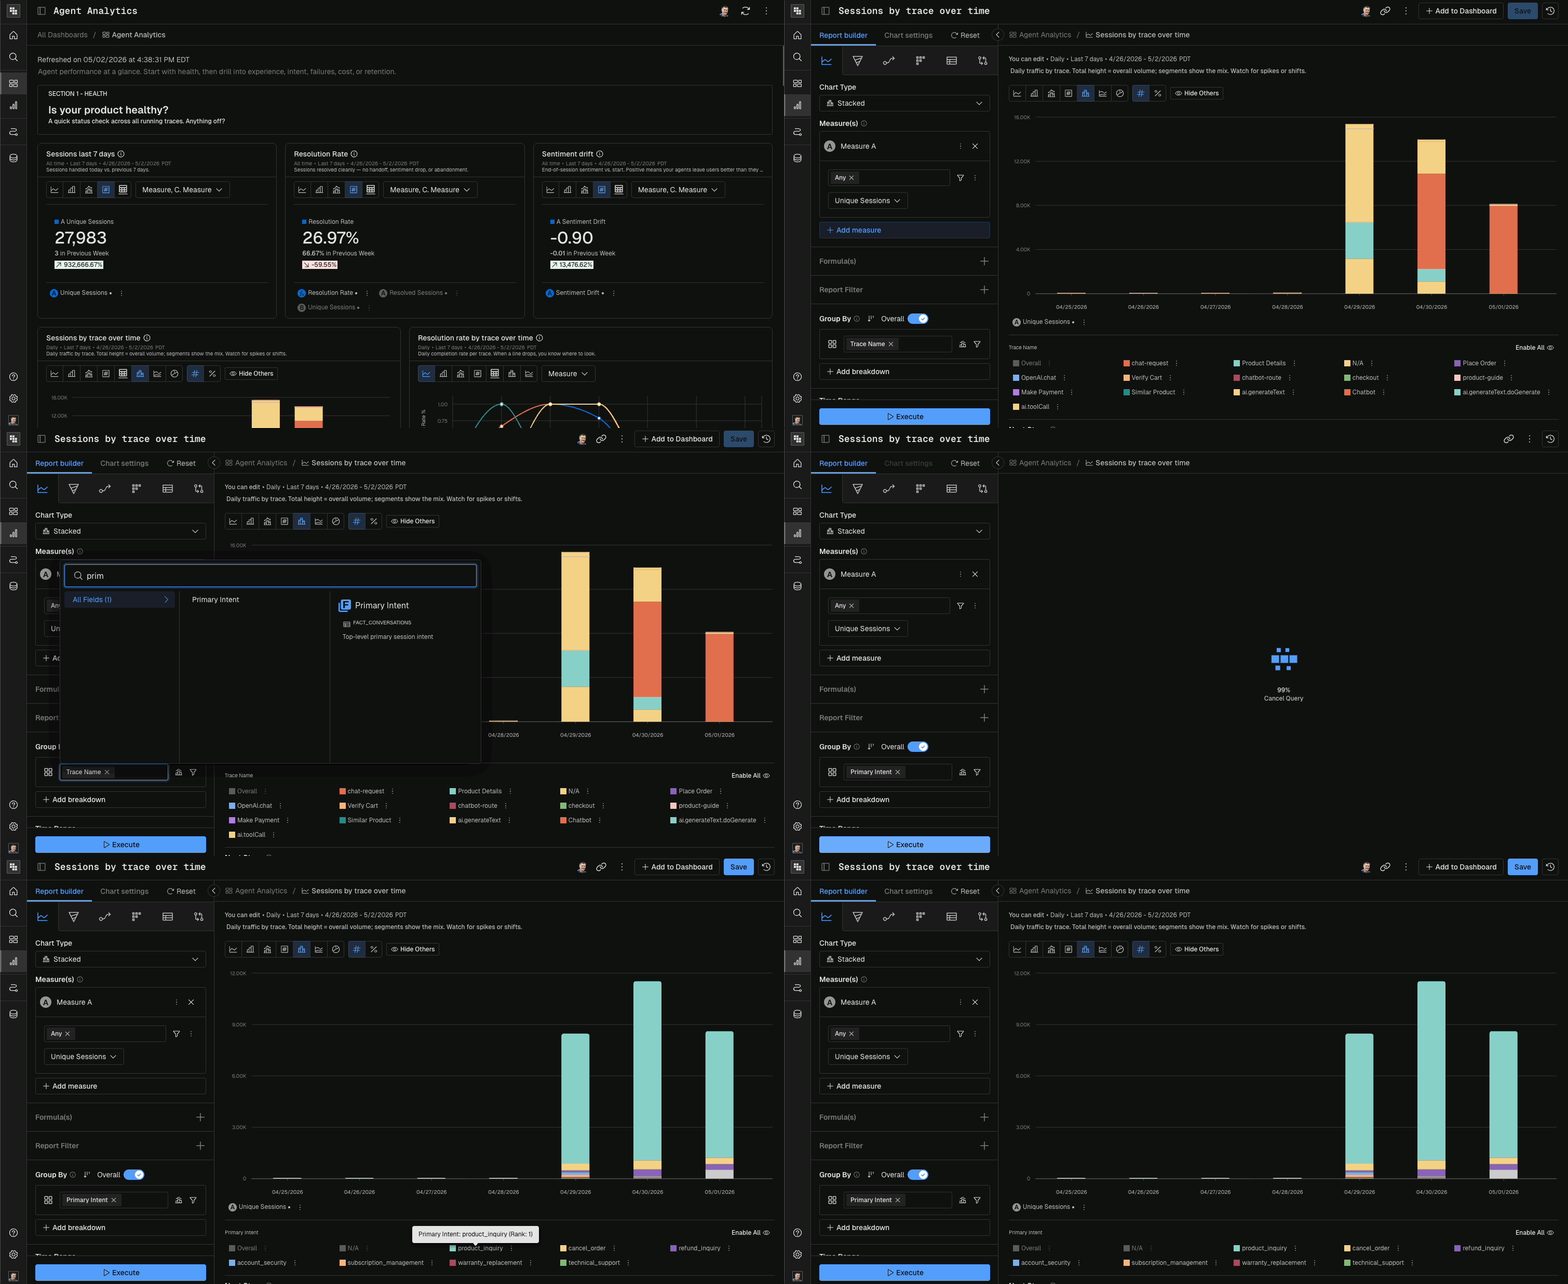
Click into any report on the dashboard to inspect the underlying data, change filters, or jump to the users behind a segment.
Drill in freely — reports in Kubit are immutable. Every execution creates a new report, so any filter, breakout, or tweak you make from a drill-in never overwrites the original or affects what your teammates see.
Create a new dashboard
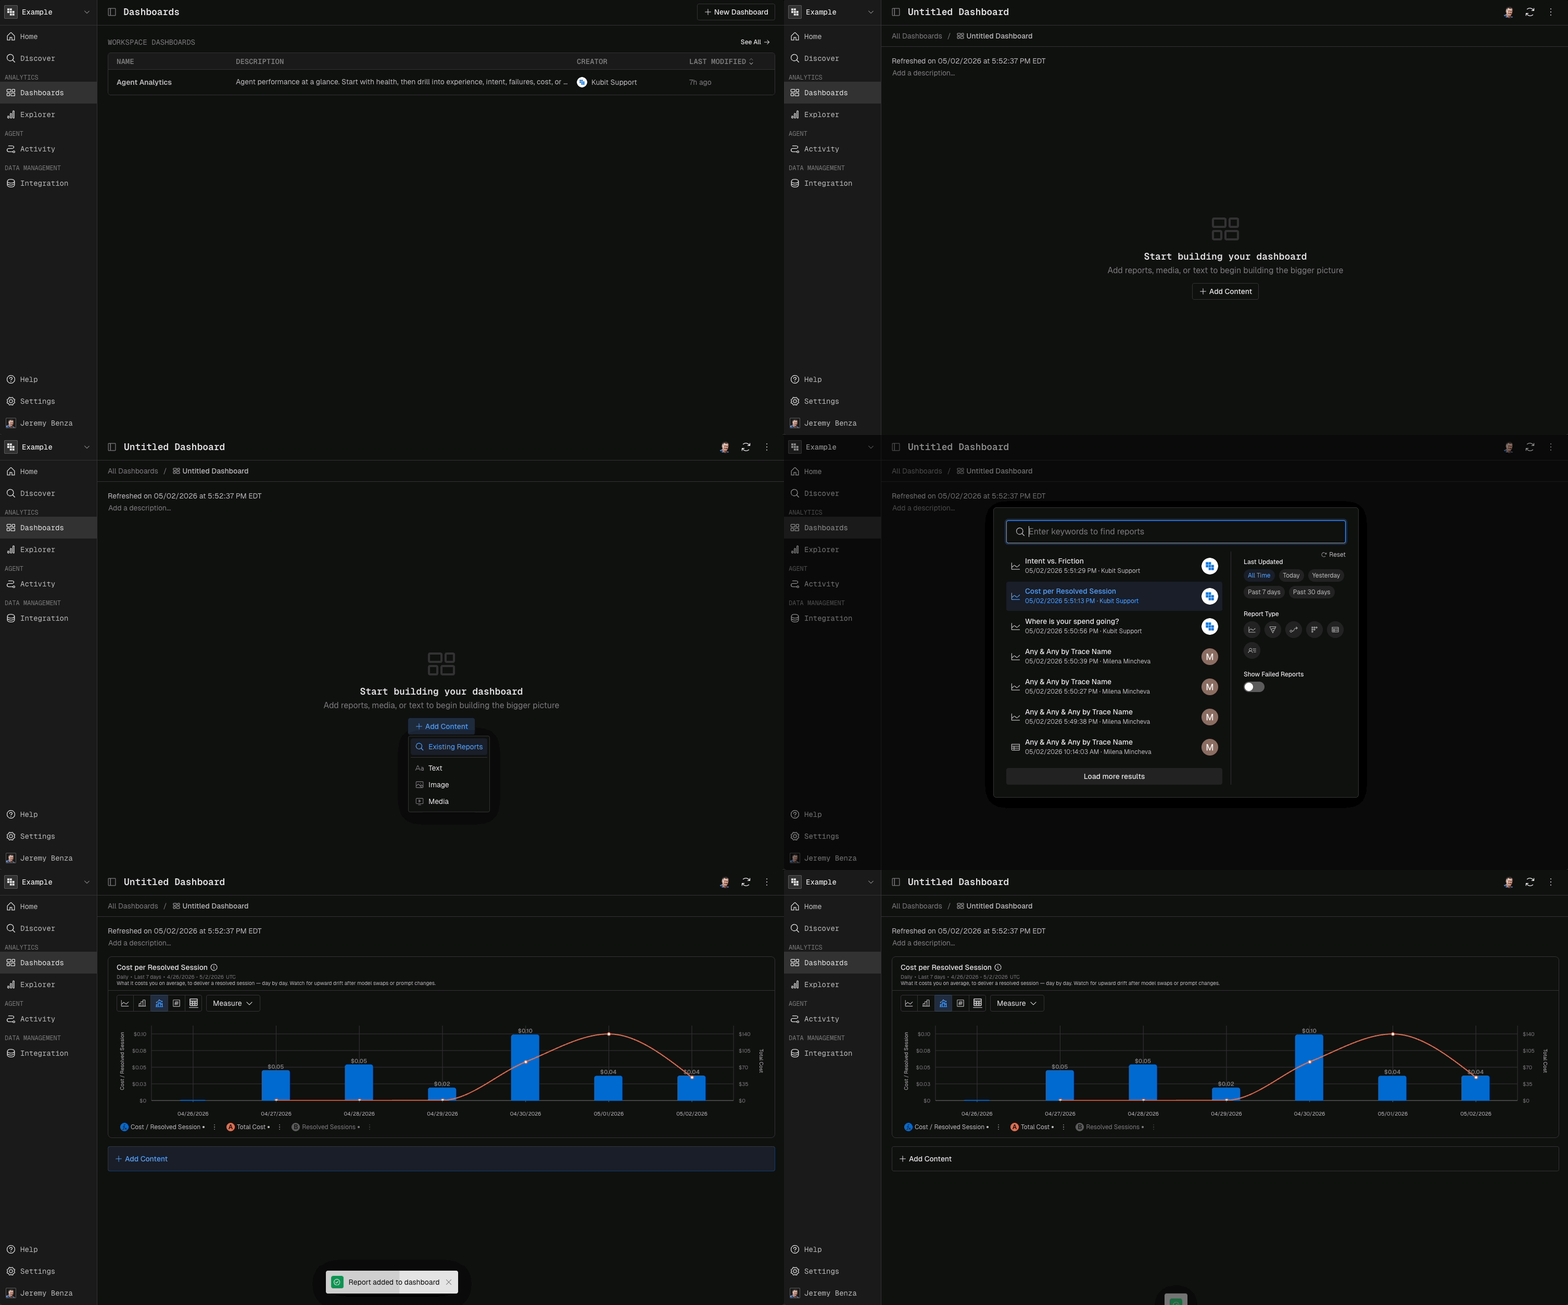
When you want your own view, you can spin up a new dashboard at any time.
From the Dashboards list, click New Dashboard in the top-right.
Name your dashboard.
Add existing reports, or create a new report from scratch.
Next steps
Build your first report and add it to your new dashboard — see Reports.