Integrate your App
Now it is time to integrate your own application to send the LLM traces over to Kubit and start getting insights from Agent Analytics.
If you haven't done so yet, please
Install Kubit Plugin to Claude Code or Cursor
(Optional) Sign Up manually, or wait for OAuth to take you through the flow.
(Optional) Check out the Example workspace and Demo Store
Overview
kubit-integrate will config your project to send LLM traces to Kubit through OpenTelemetry instrumentation:
Detect your tracing setup in the current repo, including AI Framework (e.g. Langchain, Vercel AI) and Observability SDK (Langfuse, Braintrust, Arize or Langsmith).
Ensure a Kubit session (delegating to
/kubit-connectif you don't have one).Pick a workspace — use your current one, switch to another in your org, or create a new one.
Mint an ingestion API key scoped to that workspace.
Write the key into your repo's
.env.localor.env(gitignore-checked).Install the Kubit SDK via your project's package manager.
Wire Kubit's span processor into your existing tracing setup — merging into your existing wiring file when one exists, or scaffolding a standalone bootstrap file when none does.
Your existing tracing setup won't be impacted since Kubit's span processor will work in parallel through OTel fan-out.
After it finishes, you run a single verification command (printed at the end) and traces should appear in Kubit once you app starts running.
Data Flow
LLM traces generated through instrumentation done by your existing Observability tool or our SDK will be sent to Kubit's OTel endpoint.
The traces will be ingested in near real-time and available in Agent Activity, or you can check using skills
❯
/kubit-inspecttraces in last 30 minutes
Enrichment batch job will run periodically to extract intent, sentiment and resolution from the traces
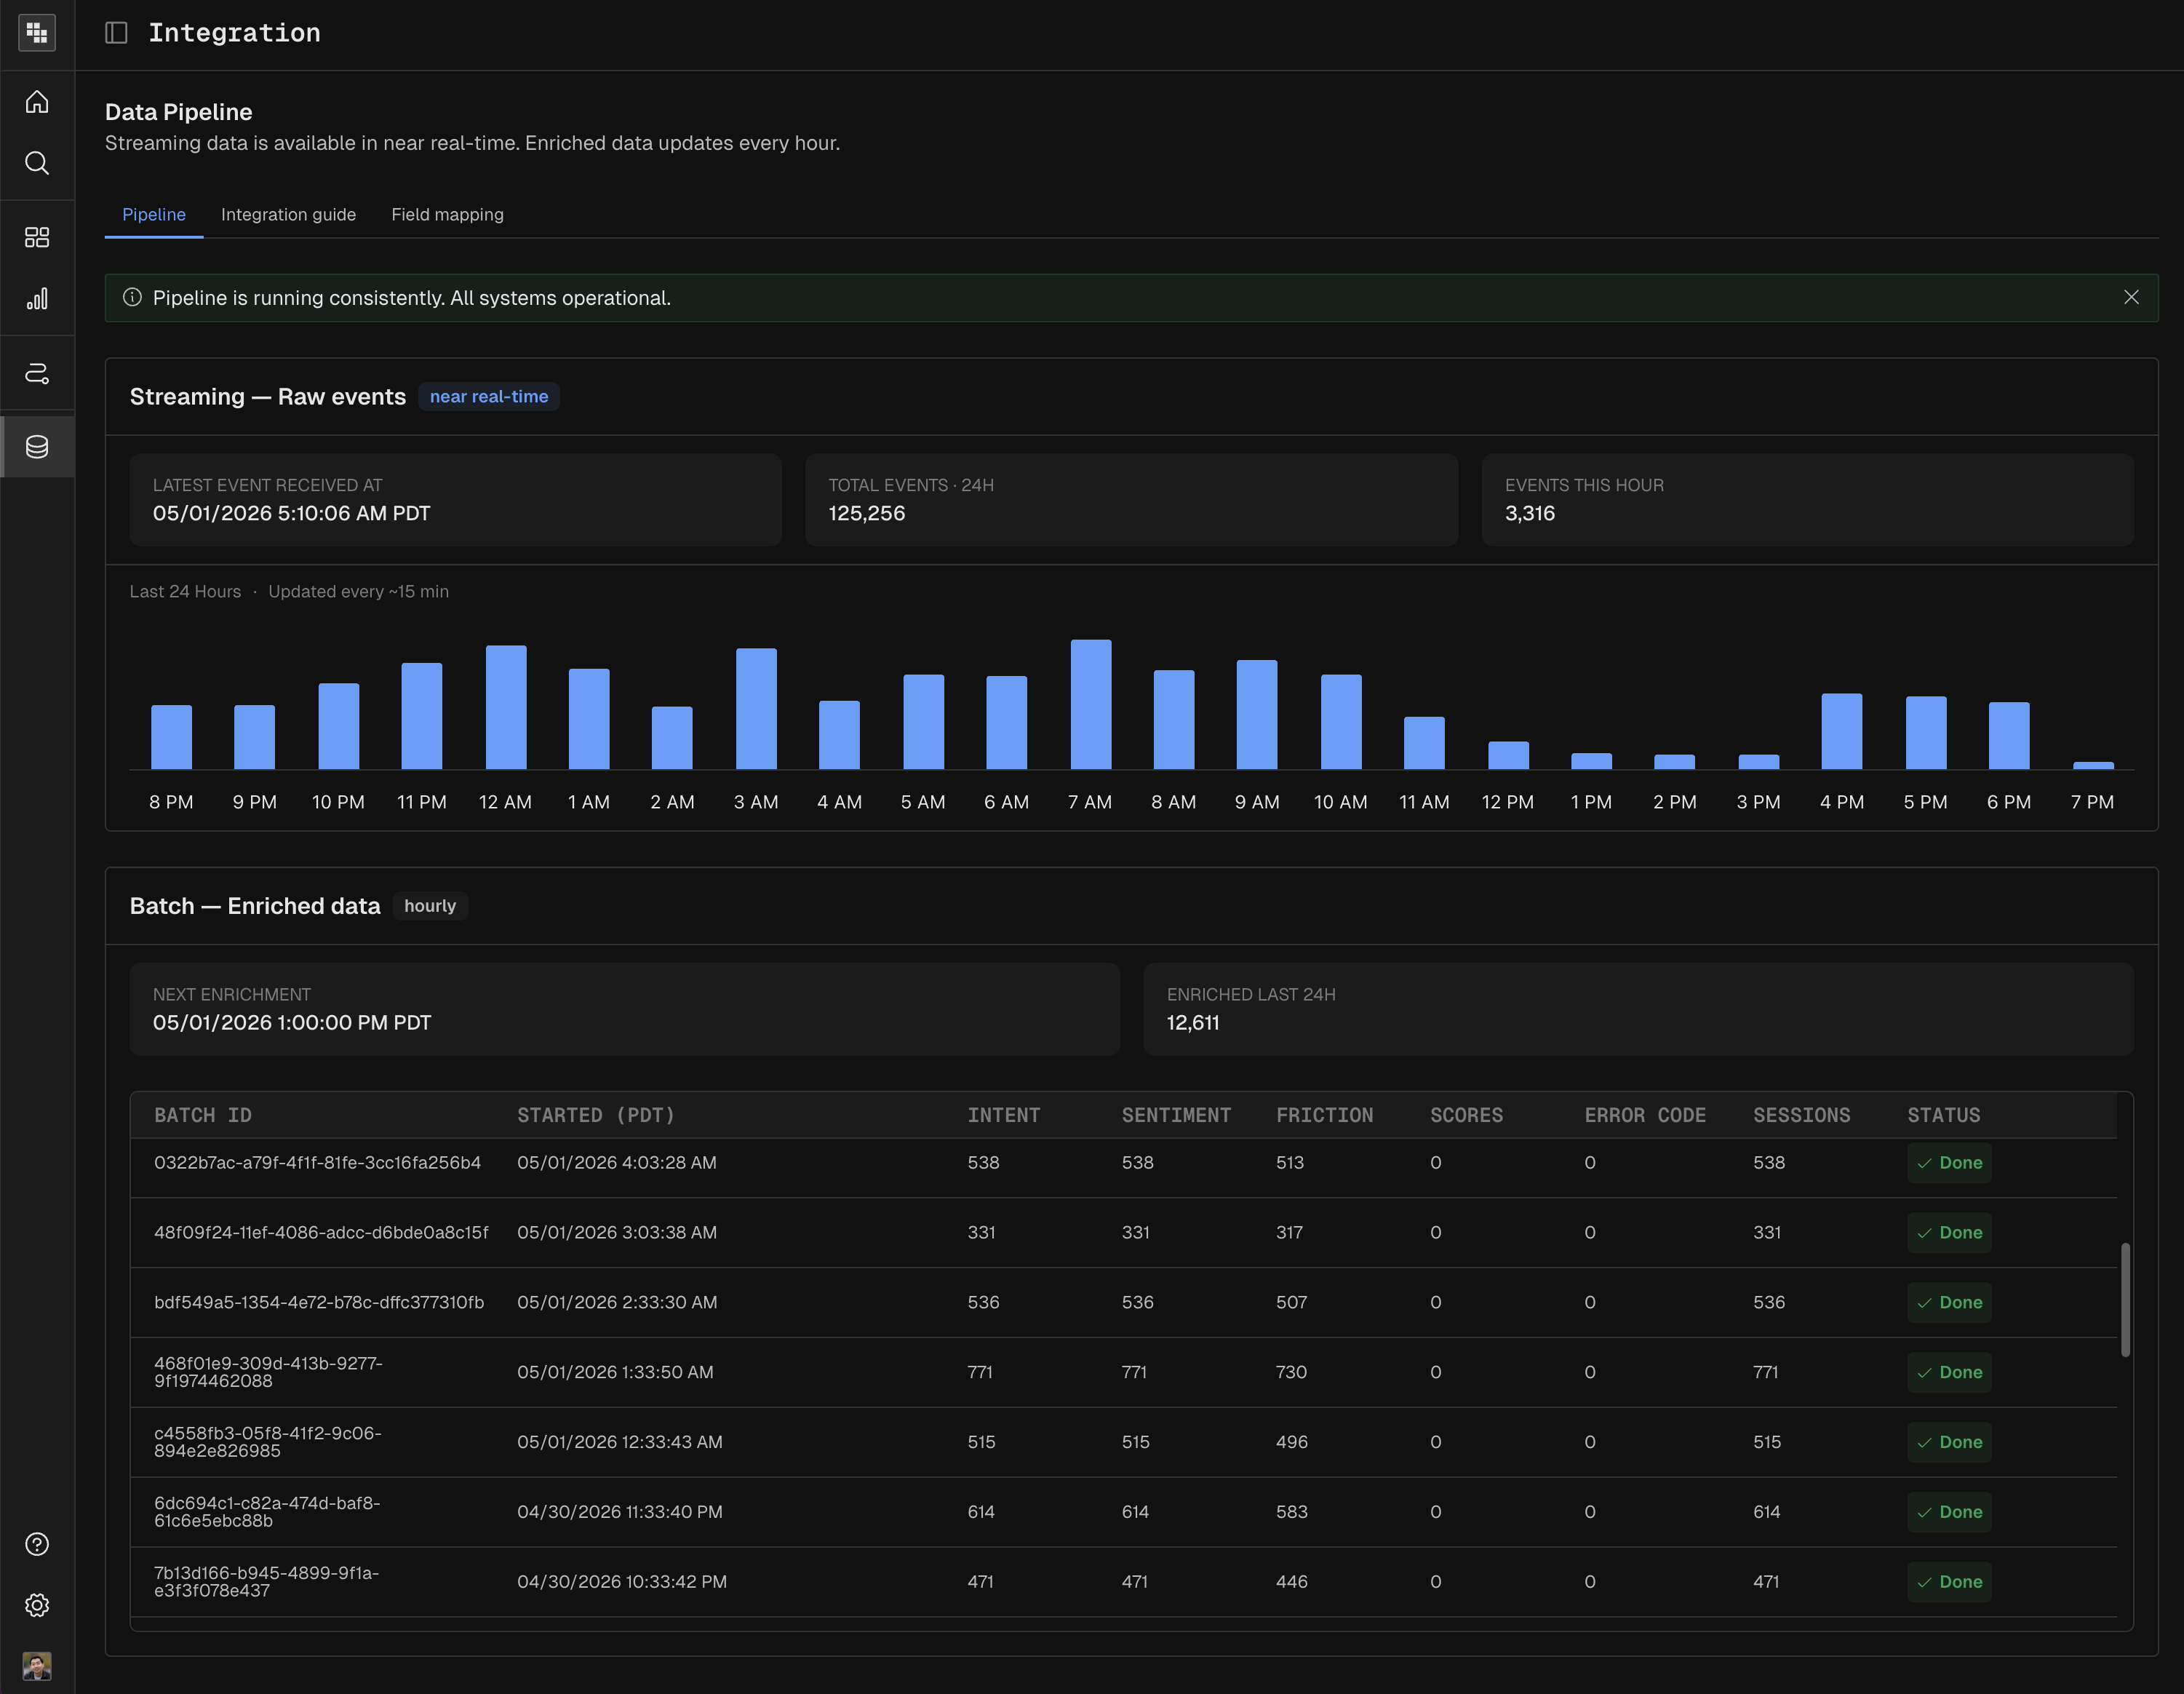
You can check the data pipeline status in Integration:
Next steps
Find the traces from your application in Agent Activity, or analyze them in Dashboards or Reports.
Use Kubit Skills to get insights
Get Support if you run into troubles
Learn about advanced configuration like Field Mapping.